Albert Einstein called compound interest the eighth wonder of the world. I cannot find any mention of him commenting on dollar cost averaging but even if it does not rank as the ninth wonder, it is definitely worth a day trip in your financial travels. Dollar cost averaging is the investment technique of buying a fixed dollar amount of a particular security on a regular schedule, regardless of the market price. Using this method will force you to buy more shares when prices are lower and fewer shares in up-cycles. The results can be significant.
Investors have been disappointed with the below average return on stocks in recent years. Historically the S&P 500 index has returned an average annual growth rate of about 10.8% but recent market returns have not measured up. For a specific example, look at the returns on the S&P 500 since the last cyclical high in late 2007. A lump sum investment in the index would today have generated an average annual return of just 5.70% per year as of the beginning of this month.
The results are much different for an investor who began to dollar cost average at the same time with an initial purchase at the 2007 high. Using S&P 500 index data and regular monthly purchases of the index at a fixed dollar amount, the average annual return would have been 10.65%. Dollar cost averaging is a powerful tool over sufficiently long periods of time. At first glance, it does not seem possible but do the math yourself, then teach it to your children and grandchildren.
Disclaimer: Dollar cost averaging will not work with all assets. The S&P 500 index cannot be purchased and is used only for the purpose of demonstration. Past returns are not an indication of future returns.
What We Are Watching So You Don’t Have To
On The One Hand
- Retail sales increased 0.8% in October after an upwardly revised 1.0% increase for September. Retail sales ex-autos also increased 0.8% adding to an upwardly revised 0.7% increase for September.
- Import prices increased 0.5% in October, but were down 0.1% excluding fuel. Export prices increased 0.2% in October and they were also up 0.2%, excluding agriculture.
- The NY Fed reported the Empire State Manufacturing Survey index climbed out of negative territory for the first time in four months, rising from -6.5 to 1.5. The new orders and shipments indexes also turned positive, rising to 3.1 and 8.5, respectively.
- Total business inventories increased 0.1% in September after increasing 0.2% in August. Sales were up 0.7% following an upwardly revised 0.3% in August. Business inventories remain at an elevated level relative to sales, but have started to turn lower in recent months.
- The CPI increased 0.4%, as expected, in October while core CPI, which excludes food and energy, rose 0.1%.
- October housing starts surged 25.5% to a seasonally adjusted annual rate of 1.323 million. Building permits rose 0.3% to a seasonally adjusted annual rate of 1.229 million. Both releases were better than expected.
- Initial claims for the week ending November 12 dropped by 19,000 to 235,000, the lowest level since November 24, 1973. Continuing claims decreased by 66,000 to 1.977 million, the lowest level since April 15, 2000.
- The Philadelphia Fed Index dipped to 7.6 in November after a 9.7 reading in October. A reading above zero indicates expansion and this was the fourth straight month the index has been in positive territory.
- The Conference Board’s Leading Economic Index increased 0.1% in October after increasing 0.2% in September. The Lagging Economic Index increased 0.2% on top of a 0.2% increase in September.
On The Other Hand
- The Producer Price Index for final demand in October was unchanged, less food and energy the index was down 0.2%. Neither met expectations. On a year-over-year basis, the index for final demand is up 0.8%.
- Industrial production was unchanged in October after a downwardly revised decline of 0.2% in September. The capacity utilization rate slipped to 75.3%. The release was not as bad as the headline numbers suggest as the softness is driven entirely by a 2.6% decline in utilities output.
All Else Being Equal
The U.S. economic data released last week continues to show expansion. The fixed income markets seem to be confirming the expansion.
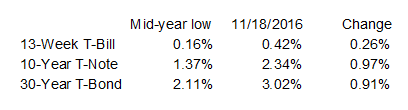
Interest rates do not rise in the face of economic weakness and the rise supports the expectation of a likely increase by the Fed.
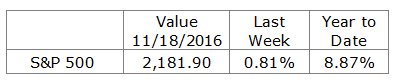
Last Week’s Market
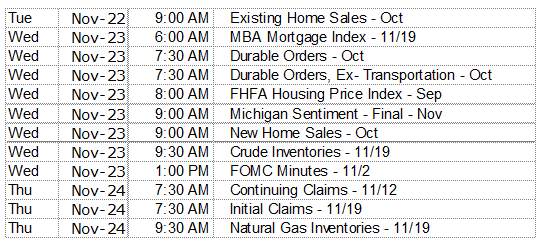
The Week Ahead