The stock market was closed last Monday in honor of Presidents’ Day. Equities were mixed on the first day of trading last Tuesday. The Dow advanced 0.2% and the Global Dow gained 0.3%. The remaining benchmark indexes lost value, led by the Russell 2000, which fell 0.7%, followed by the Nasdaq (-0.3%) and the S&P 500 (-0.1%). Prices on 10-year Treasuries plunged, sending yields soaring. Crude oil prices climbed over $60 per barrel for the first time in several months. The dollar inched ahead 0.3%. Market sectors were mixed with energy, financials, and communication services climbing, while utilities, real estate, and health care fell.
The Dow reached a record high last Wednesday, a day that saw the remaining benchmark indexes lose value. Energy led several surging sectors on a day when only industrials, materials, and information technology fell. Yields on 10-year Treasuries continued to climb. Crude oil prices soared past $61 per barrel, and the dollar advanced nearly 0.5%. Inflationary pressures seem to be rising as producer prices advanced 1.3% in January and retail sales surged by more than 5.0%. As inflation nears the 2.0% mark, the Federal Reserve may scale back support and rethink the timeline for raising interest rates.
The Dow couldn’t keep its streak of positive sessions alive last Thursday, closing down 0.4% by the end of trading. Overall, stocks plunged to the lowest levels in more than a week, as each of the indexes listed here finished in the red, with the small caps of the Russell 2000 taking the biggest hit, falling 1.7%. The Global Dow dropped 0.8%, followed by the Nasdaq, which fell 0.7%, and the S&P 500, which sank 0.4%. Money moved to bonds, driving prices higher and yields lower. Crude oil prices dropped, but remained over $60 per barrel. The dollar weakened. Among the sectors, only consumer discretionary and utilities posted gains, while energy slumped 2.3% on the day.
Stocks edged higher last Friday, with only the S&P 500 closing the day in the red. The Russell 2000 climbed 2.2%, the Global Dow advanced 0.5%, and the Nasdaq inched up 0.1%. The Dow was flat on the day. Materials, energy, industrials, and financials showed strong momentum, each gaining at least 1.0%. Utilities, consumer staples, health care, and communication services fell by at least 1.0%. The yield on 10-year Treasuries climbed higher, while crude oil and the dollar dropped.
Despite a late-week surge, stocks were mixed to lower last week. The Dow and the Global Dow closed ahead, while the Nasdaq, the Russell 2000, and the S&P 500 lost value. Treasury yields rose but the dollar, crude oil prices, and gold fell. Among the sectors, energy (3.1%) and financials (2.8%) led the way, while health care (-2.5%), utilities (-2.0%), information technology (-1.9%), and consumer staples (-1.1%) plunged. Investors seem to be keeping their collective eyes on the prospects of more stimulus and signs of inflation and rising interest rates.
The national average retail price for regular gasoline was $2.501 per gallon on February 15, $0.040 per gallon over the prior week’s price and $0.073 higher than a year ago. during the week ended February 12, crude oil refinery inputs averaged 14.8 million barrels per day, which was 27,000 barrels per day more than the previous week’s average. Refineries operated at 83.1% of their operable capacity last week.
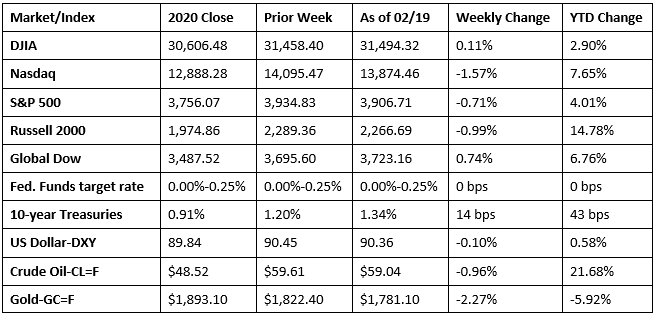
Chart reflects price changes, not total return. Because it does not include dividends or splits, it should not be used to benchmark performance of specific investments.
Last Week’s Economic News
- Producer prices increased 1.3% in January, the largest monthly advance since the index began in December 2009. Producer prices have risen 1.7% over the 12 months ended in January. Producer prices less foods, energy, and trade services moved up 1.2% in January, the largest advance since September 2013. Prices for services rose 1.3% last month, and prices for goods climbed 1.4%. In January, prices for food increased 1.4%, and energy prices advanced 5.1%.
- Sales at the retail level also advanced in January, climbing 5.3% for the month and 7.4% over January 2020. Retail sales fell 0.1% in December. In January, all business categories saw sales increase, with noteworthy advances occurring for department stores (23.5%), furniture and home furnishings stores (12.0%), electronics and appliance stores (14.7%), and online retail sales (11.0%).
- According to the latest report from the Federal Reserve, industrial production rose 0.9% in January. Manufacturing output advanced 1.0%, mining production climbed 2.3%, while output for utilities fell 1.2%. Total industrial production in January was 1.8% lower than it was in January 2020. Overall, while industrial production continues to rise, it remains below its pre-pandemic levels of February 2020.
- Prices for U.S. imports increased 1.4% in January after rising 1.0% in December. The January increase was the largest since March 2012. Import prices rose 0.9% for the year ended in January, the first over-the-year increase since January 2020 and the largest 12-month advance since the index increased 3.4% from October 2017 to October 2018. Import fuel prices increased 7.4% in January, although import fuel prices decreased 13.4% for the year ended in January. Export prices rose 2.5% last month following a 1.3% jump in December. The latest increase in export prices was the largest since December 1988. For the year ended in January 2021, exports rose 2.3%, the largest 12-month increase since a 3.1% advance in October 2018. Agricultural export prices increased 6.0% in January, while nonagricultural export prices rose 2.2%, largely driven by a 6.0% increase in industrial supplies and materials.
- Prices for U.S. imports increased 1.4% in January after rising 1.0% in December. The January increase was the largest since March 2012. Import prices rose 0.9% for the year ended in January, the first over-the-year increase since January 2020 and the largest 12-month advance since the index increased 3.4% from October 2017 to October 2018. Import fuel prices increased 7.4% in January, although import fuel prices decreased 13.4% for the year ended in January. Export prices rose 2.5% last month following a 1.3% jump in December. The latest increase in export prices was the largest since December 1988. For the year ended in January 2021, exports rose 2.3%, the largest 12-month increase since a 3.1% advance in October 2018. Agricultural export prices increased 6.0% in January, while nonagricultural export prices rose 2.2%, largely driven by a 6.0% increase in industrial supplies and materials.
- Sales of existing homes rose in January for the second consecutive month. According to the latest report from the National Association of Realtors®, total existing home sales advanced 0.6% last month and are up 23.7% since January 2020. The median existing home price for all housing types in January was $303,900 ($309,800 in December), up 14.1% from January 2020. As the sales market continued to boom, existing inventory of homes for sale dwindled. In January, total housing inventory was down 1.9% from December and sits at a 1.9-month supply. Single-family home sales also increased in January, advancing 0.2% from December. The median existing single-family home price was $308,300 in January, down from December’s price of $314,300.
- For the week ended February 13, there were 861,000 new claims for unemployment insurance, an increase of 13,000 from the previous week’s level, which was revised up by 55,000. According to the Department of Labor, the advance rate for insured unemployment claims was 3.2% for the week ended February 6. For comparison, during the same period last year, there were 215,000 initial claims for unemployment insurance, and the insured unemployment claims rate was 1.2%. The advance number of those receiving unemployment insurance benefits during the week ended February 6 was 4,494,000, a decrease of 64,000 from the prior week’s level, which was revised up by 13,000. States and territories with the highest insured unemployment rates in the week ended January 30 were in the Virgin Islands (6.6%), Alaska (6.4%), Pennsylvania (6.4%), Rhode Island (6.1%), Nevada (6.0%), Connecticut (5.3%), Illinois (5.1%), New York (5.1%), New Mexico (5.0%), and Massachusetts (4.9%). The largest increases in initial claims for the week ended February 6 were in Ohio (+92,667), California (+28,688), Georgia (+5,171), Mississippi (+3,796), and Colorado (+3,045), while the largest decreases were in Florida (-47,430), New York (-17,407), Maryland (-16,585), Kansas (-12,376), and Arizona (-7,478).
Eye on the Week Ahead
The last week of February brings with it several important economic reports, led by the second estimate of the fourth-quarter gross domestic product. The initial, or advance, estimate saw the economy expand at an annual rate of 4.0%. Also out this week is the January issue of the personal income and outlays report. The personal consumption expenditures price index, an inflation indicator relied on by the Federal Reserve, showed that consumer prices rose 0.4% in December and advanced only 1.3% in 2020.
The Week Ahead

The information provided is obtained from sources believed to be reliable. Forecasts cannot be guaranteed. Past performance is not a guarantee of future results.
© 2021 Broadridge Financial Solutions, Inc. All Rights Reserved.