Strong economic data and a growing number of vaccinated Americans helped fuel significant market gains last Monday. The prior week’s favorable jobs report, coupled with purchasing managers’ encouraging news in both the manufacturing and services sectors, provided encouragement for investors. The Nasdaq rose 1.7%, followed by the S&P 500 (1.4%), the Dow (1.1%), the Global Dow (0.8%), and the Russell 2000 (0.5%). The yield on 10-year Treasuries climbed 2.4%, while the dollar and crude oil prices fell. Among the sectors, a major oil sell-off pushed energy prices lower. Otherwise, the major market sectors jumped higher, led by consumer discretionary, communication services, and information technology, each of which gained more than 2.0%.
Stocks ended last Tuesday in the red after reaching all-time highs earlier in the day. Information technology, health care, and energy pulled equities lower, offsetting gains in consumer discretionary, consumer staples, and utilities. Other than the Global Dow, which inched up 0.2% on the day, each of the benchmark indexes closed lower, with the Dow and the Russell 2000 falling the most (-0.3%). Treasury yields reversed course from the previous day by dropping 3.7%. Crude oil prices advanced, while the dollar slipped.
Stocks were mixed last Wednesday following a slow day of trading. The large caps of the Dow and the S&P 500 posted modest gains, while the Nasdaq slipped and the Russell 2000 plunged. Communication services, energy, financials, and information technology led the sectors. Materials sank. Crude oil prices and the dollar rose, while Treasury yields dipped.
Equities rebounded last Thursday, with the S&P 500 reaching a record high. Technology shares drove much of the overall market increase, while pushing the Nasdaq up 1.0% on the day. The Russell 2000 climbed 0.9%, the S&P 500 gained 0.4%, the Dow advanced 0.2%, and the Global Dow broke even. Treasury yields fell for the third consecutive day. The dollar weakened, while crude oil prices inched ahead.
Stocks ended last week on a positive note, despite worries that inflation is ramping up. Both the Dow and the S&P 500 reached record highs. Consumer discretionary, health care, and information technology led the sectors. Yields on 10-year Treasuries rose and the dollar inched higher. Crude oil prices dipped.
Investors remained confident that the Federal Reserve would continue to support the economy, even as signs of inflationary pressures were evident. Overall, stocks advanced last week, with the Nasdaq climbing more than 3.0%, followed by the S&P 500 and the Dow. Information technology and consumer discretionary led the sectors, each advancing more than 4.2%. Treasury yields, the dollar, and crude oil prices fell, while gold prices advanced. So far in 2021, the small caps of the Russell 2000 remain well ahead of their 2020 closing values, despite losing value last week, followed by the Global Dow, the Dow, the S&P 500, and the Nasdaq.
The national average retail price for regular gasoline was $2.857 per gallon on April 5, $0.005 per gallon more than the prior week’s price and $0.933 higher than a year ago. Over the same period, the national average retail price for diesel fuel was $3.144 per gallon, $0.017 per gallon below last week’s level but $0.596 higher than a year ago.
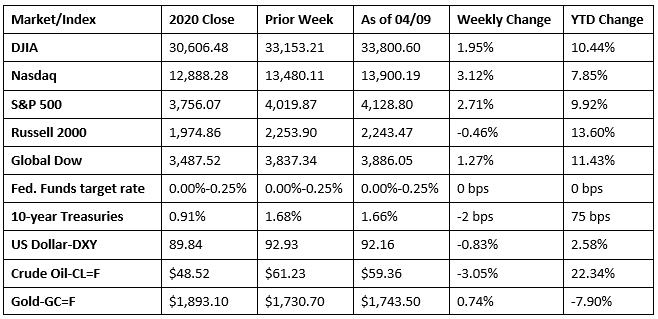
Chart reflects price changes, not total return. Because it does not include dividends or splits, it should not be used to benchmark performance of specific investments.
Last Week’s Economic News
- The final IHS Markit US Services PMI Business Activity Index registered 60.4 in March, up from 59.8 in February. This is the fastest rate of growth in the services sector since July 2014. Survey respondents attributed the expansion to greater client demand and easing of pandemic-related restrictions. Of note, input costs soared in March, as the rate of inflation accelerated at its fastest pace since data collection for the services survey began in October 2009. Subsequently, service providers sought to pass on higher costs to clients through a sharper rise in selling prices.
- The first inflationary indicator for March showed mounting price pressures. Producer prices advanced 1.0% in March and have risen 4.2% for the 12 months ended in March — the largest increase since rising 4.5% for the 12 months ended September 2011. Prices producers received for goods jumped 1.7% last month, the largest increase since December 2009. Energy prices climbed 5.9%, accounting for nearly 60.0% of the overall increase in goods prices. Within energy, gasoline prices surged 8.8% in March. Producer prices for services rose 0.7% last month, and are up 3.0% over the 12 months ended in March.
- According to the latest Job Openings and Labor Turnover Summary, the number of job openings edged up by 268,000 to 7.4 million on the last day of February. The number of hires increased by roughly 273,000 to 5.7 million, and the number of separations rose by 133,000 to 5.5 million. Over the 12 months ended in February, hires totaled 72.3 million and separations totaled 80.9 million, yielding a net employment loss of 8.6 million.
- The international trade in goods and services deficit rose 4.8% to $71.1 billion in February, according to the latest report from the Bureau of Economic Analysis. Exports fell 2.6%, while imports inched down 0.7%. Year to date, the goods and services deficit increased $56.5 billion, or 68.6%, from the same period in 2020. Exports decreased $36.2 billion, or 8.7%, while imports increased $20.3 billion, or 4.1%.
- For the week ended April 3, there were 744,000 new claims for unemployment insurance, an increase of 16,000 from the previous week’s level, which was revised up by 9,000. According to the Department of Labor, the advance rate for insured unemployment claims was 2.6% for the week ended March 27, unchanged from the previous week’s rate. For comparison, during the same period last year, there were 6,149,000 initial claims for unemployment insurance, and the insured unemployment claims rate was 5.4%, as the effects of the pandemic continued to impact the labor market. The advance number of those receiving unemployment insurance benefits during the week ended March 27 was 3,734,000, a decrease of 16,000 from the prior week’s level, which was revised down by 44,000. This is the lowest level for insured unemployment since March 21, 2020, when it was 3,094,000. States and territories with the highest insured unemployment rates in the week ended March 20 were in Puerto Rico (6.0%), the Virgin Islands (5.6%), Nevada (5.3%), Alaska (5.0%), Pennsylvania (5.0%), Connecticut (4.6%), New York (4.1%), Rhode Island (3.9%), Illinois (3.8%), and California (3.7%). The largest increases in initial claims for the week ended March 27 were in Kentucky (+16,100), Georgia (+14,493), Virginia (+10,684), California (+10,408), and New York (+8,557), while the largest decreases were in Ohio (-14,879), Massachusetts (-12,001), Indiana (-3,785), Florida (-1,633), and Michigan (-1,622).
Eye on the Week Ahead
Inflationary pressures are beginning to be evident as more economic data for March is released. The Consumer Price Index advanced 0.4% in February and is expected to increase by at least that much in March. In another sign of rising prices, import and export prices are expected to escalate further in March after surging in February.
The Week Ahead

The information provided is obtained from sources believed to be reliable. Forecasts cannot be guaranteed. Past performance is not a guarantee of future results.
© 2021 Broadridge Financial Solutions, Inc. All Rights Reserved.