Each of the benchmark indexes listed here advanced last week, led by the S&P 500, which rose 1.6%. Corporate earnings data for the third quarter has gotten off to a solid start to help push stocks higher. However, investors are paying close attention to elevated inflation, driven higher by global supply-chain constraints and labor shortages. According to Chair Jerome Powell, the Federal Reserve is closely monitoring price pressures, which may last longer than previously expected, increasing the possibility that the Fed may raise interest rates sooner than anticipated. Treasury yields and crude oil prices rose last week, while the dollar slid. Gold prices climbed higher but remain well below their 2020 year-end values. The market sectors closed last week generally higher, with only communication services lagging. Real estate (3.2%), health care (2.9%), and financials (2.8%) led the advancing sectors.
Stocks opened last Monday mixed, with megacaps and growth stocks outperforming value shares and cyclicals. The Nasdaq gained 0.8%, followed by the S&P 500 (0.3%) and the Russell 2000 (0.1%). The Dow (-0.1%) and the Global Dow (-0.2%) dipped. Crude oil prices slid, while Treasury yields and the dollar advanced. The market sectors were mixed, with consumer discretionary, information technology, and communication services advancing, while utilities, energy, and industrials slipped.
More solid corporate earnings data helped drive stocks higher last Tuesday. The Nasdaq and the S&P 500 each advanced 0.7%, while the Dow gained 0.6%. The Global Dow added 0.5% and the Russell 2000 increased 0.3%. Ten-year Treasury yields increased 322 basis points to close at 1.63%. Crude oil prices rose to $82.87 per barrel. The dollar edged lower. Among the market sectors, only consumer discretionary failed to advance. Health care, energy, and utilities rose by more than 1.0%.
Another day of favorable corporate quarterly earnings data helped push the Dow and the S&P 500 higher last Wednesday. The Nasdaq slipped 0.1%. The Russell 2000 and the Global Dow also advanced. Treasury yields inched higher, the dollar dipped lower, while crude oil prices climbed to over $84.00 per barrel. Health care, real estate, and utilities each rose over 1.5% on a day that saw several of the market sectors advance.
Consumer discretionary shares helped push the S&P 500 up 0.3% to reach a record high last Thursday. The Nasdaq led the benchmarks after climbing 0.6%. The Russell 2000 also advanced 0.3%. The Global Dow dropped 0.6%, while the Dow was flat. Ten‐year Treasury yields and the dollar increased, while crude oil prices fell to $82.67 per barrel.
Stocks closed mixed last Friday, with the Dow edging up 0.2% to reach a record high. The Global Dow, the only other index to post a gain, inched up 0.1%. The Nasdaq fell 0.8%, the Russell 2000 dipped 0.2%, and the S&P 500 dropped 0.1%. Ten-year Treasury yields and the dollar slid, while crude oil prices rose. The market sectors also returned mixed results last Friday, with consumer staples, energy, financials, health care, industrials, real estate, and utilities advancing, while communication services, consumer discretionary, information technology, and materials fell.
The national average retail price for regular gasoline was $3.322 per gallon on October 18, $0.055 per gallon more than the prior week’s price and $1.172 higher than a year ago. Gasoline production increased during the week ended October 15, averaging 10.1 million barrels per day. U.S. crude oil refinery inputs averaged 15.0 million barrels per day during the week ended October 15 — 71,000 barrels per day less than the previous week’s average. Refineries operated at 84.7% of their operable capacity, down from the prior week’s level of 86.7%.
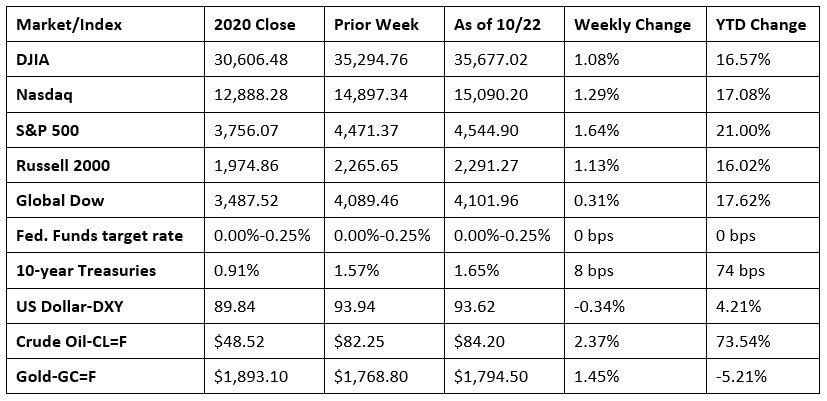
Chart reflects price changes, not total return. Because it does not include dividends or splits, it should not be used to benchmark performance of specific investments.
Last Week’s Economic News
- Industrial production fell 1.3% in September following a 0.1% drop in August (revised). In September, manufacturing output decreased 0.7%, driven lower by a 7.2% decline in the production of motor vehicles and parts, as shortages of semiconductors continued to hobble operations. The output of utilities dropped 3.6%, as demand for cooling subsided after a warmer-than-usual August. Mining production fell 2.3%. Despite the decrease in September, total industrial production rose at an annual rate of 4.3% for the third quarter, its fifth consecutive quarter with a gain of at least 4%. Total industrial production in September was 4.6% above its year-earlier level.
- New home construction slowed in September. According to the latest report from the Census Bureau, the number of issued building permits for all housing types fell 7.7% last month. Permits for single-family homes dipped 0.9%. Housing starts dropped 1.6% last month, while single-family housing starts were virtually unchanged from August. Housing completions in September declined 4.6%. Housing completions of single-family homes were virtually unchanged.
- Existing-home sales rose 7.0% in September after seeing sales wane the previous month. Nevertheless, sales of existing homes are down 2.3% from September 2020. Total housing inventory in September fell 0.8% from August and is down 13.0% from September 2020. Unsold inventory sits at a 2.4-month supply at the present sales pace, down from the August pace of 2.6 months. The median existing-home price was $352,800 in September, down from the August price of $356,700. Single-family home sales rose 7.7% last month but are down 3.1% from a year ago. The median existing single-family home price was $359,700 in September, down from the August price of $363,800.
- The September Treasury statement of government receipts and outlays is the final one for fiscal year 2021. The government deficit was $61.5 billion in September, $109.1 billion lower than the August deficit and 51.0% less than the September 2020 deficit. In September, outlays totaled $521.1 billion (5.0% higher than September 2020), while receipts totaled $459.5 billion (23.0% over September 2020). The total government deficit for FY 2021 was $2.8 trillion — 11.0% smaller than the FY 2020 shortfall. For FY 2021, government expenditures rose by 4.0% ($6.8 trillion), which was more than offset by an 18.0% increase in receipts ($4.1 trillion). In fiscal year 2021, individual income tax receipts were 27.1% higher than FY 2020. Employment and general retirement receipts increased by 31.3%. Corporate income taxes rose by 76.0% over FY 2020.
- For the week ended October 16, there were 290,000 new claims for unemployment insurance, a decrease of 6,000 from the previous week’s level, which was revised up by 3,000. This is the lowest level for initial claims since March 14, 2020, when it was 256,000. According to the Department of Labor, the advance rate for insured unemployment claims for the week ended October 9 was 1.8%, a decrease of 0.1 percentage point from the previous week’s rate. The advance number of those receiving unemployment insurance benefits during the week ended October 9 was 2,481,000, a decrease of 122,000 from the prior week’s level, which was revised up by 10,000. This is the lowest level for insured unemployment since March 14, 2020, when it was 1,770,000. For comparison, last year at this time, there were 798,000 initial claims for unemployment insurance, and the rate for unemployment claims was 5.7%. During the last week of February 2020 (pre-pandemic), there were 219,000 initial claims for unemployment insurance, and the number of those receiving unemployment insurance benefits was 1,724,000. States and territories with the highest insured unemployment rates for the week ended October 2 were Puerto Rico (4.3%), Illinois (3.5%), California (3.3%), the District of Columbia (3.0%), Hawaii (3.0%), New Jersey (2.7%), Nevada (2.6%), Alaska (2.4%), Pennsylvania (2.3%), and New York (2.2%). The largest increases in initial claims for the week ended October 9 were in Michigan (+3,673), Missouri (+2,566), Maryland (+2,337), New Mexico (+2,012), and Kentucky (+1,454), while the largest decreases were in Tennessee (-989), California (-851), Florida (-839), New Jersey (-464), and Alabama (-301).
Eye on the Week Ahead
The initial estimate for the third-quarter gross domestic product is out this week. The economy advanced at an annualized rate of 6.7% in the second quarter. The latest data on durable goods orders is also available this week. New orders increased by 1.8% in August.
The Week Ahead

The information provided is obtained from sources believed to be reliable. Forecasts cannot be guaranteed. Past performance is not a guarantee of future results.
© 2021 Broadridge Financial Solutions, Inc. All Rights Reserved.