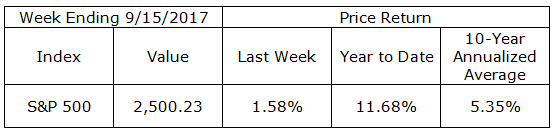
Last week began with a Monday rally of 1.08%, the best one day gain since April 24th, and a new high close for the S&P 500. The index added another 12+ points during the rest of the week and closed at a record high of 2,500.23. The last 5% or greater correction in the index took place over a period of 13 trading days, ending on June 27, 2016, when the index corrected 5.60% to close at 2,000.54. To recap, the S&P 500 is up 24.98% over the last 308 trading days without a single 5% correction. This is an excellent time to both begin and end a weekly update with the disclaimer, past performance is no indication of what the future will bring.
U.S. Treasuries lost some ground last week. Yields rose, with the 2 Year Treasury finishing the week yielding 1.38% up from 1.27% the previous Friday. The 10 Year Treasury yield was back to the 2.20% level from 2.06%.
On The One Hand
- The Producer Price Index (PPI) for August increased 0.2% month-over-month. In the past year, producer prices have increased 2.4%.
- The Consumer Price Index (CPI) increased 0.4% month-over-month in August. The higher than expected monthly figure was partly driven by a 6.3% increase in the gasoline index. On an annual basis, the index increased 1.9%.
- Initial unemployment claims decreased by 14,000 to 284,000. Continuing claims decreased by 7,000 to 1.944 million. Recent fluctuations in these weekly figures are being affected by the recent hurricanes in the south. The claims figure has nevertheless thus far remained below 300,000.
On The Other Hand
- Industrial production declined 0.9% in August but July production was revised higher to +0.4% from the originally reported +0.2%. Capacity utilization fell to 76.1% from an upwardly revised 76.9% the previous month.
- Retail sales in August declined 0.2% and the July retail sales figures showed sales were +0.3% versus the initially reported +0.6. Excluding autos, August sales increased 0.2% but missed the +0.5% consensus estimate.
- Inventories increased 0.2% in July as did total sales leaving the inventory-to-sales ratio fixed at 1.38.
All Else Being Equal
The damage from hurricanes Harvey and Irma is beginning to show up in the economic numbers. Last week’s industrial production and retail sales figures were lower partly due to Harvey which made landfall on August 25th. Concerns about the potential impact of both storms are believed to be behind the preliminary Consumer Sentiment Index for September which declined to 95.3 from the final August figure of 96.8. The initial negative impact from the storms is expected to trim growth by a few tenths of one percent in the third quarter and early fourth quarter before the rebound to the base case occurs as demand, sales and production get underway.
In the short term, third quarter GDP will be below the pre-hurricane expectations. The Atlanta Fed is now estimating Q3 GDP will come in at 2.20% and the New York Fed’s “Nowcast” puts Q3 GDP at 1.3% and Q4 GDP at 1.8%. Remember, these weekly, Fed estimates are volatile.
Last Week’s Market
The Week Ahead

The information provided is obtained from sources believed to be reliable. Forecasts cannot be guaranteed. Past performance is not a guarantee of future results.