We will finish the series on the value of a fiduciary in the coming weeks but we will pause to comment on the market activity.
The stock market has been up in four of the last five weeks. On Friday, the S&P 500 closed at 2,779.66, up 7.7% from the correction low close of 2,581.00 on February 8. Interest rates have risen slightly since the stock market’s low. On Friday, the yield on the 10-year Treasury sat at 2.91%, just 6 basis points higher than the 2.85% yield at the time of the stock market low. Over the same period, the 2-year Treasury yield has moved up from 2.13% to 2.55% on Friday.
The 10-year Treasury yield is just 37 basis points above the 2-year, raising concerns of a yield curve inversion. Before repeating the bears’ assertions of a coming recession and market crash, consider the historical facts on yield curve inversion presented by Linda Duessel, Senior Equity Strategist at Federated Investors:
The spread on the 2/10-year Treasury yield curve is its narrowest since the global financial crisis, and the current Fed policy path suggests a potential inversion as early as late next year. Every time the yield curve has inverted, a recession has followed. We all know that. But we also know that it typically takes a year or longer for a recession to come after the curve inverts. And during this period, the market historically has racked up significant gains—an average 15% over 12 months the last six times the 2-to-10 curve hit zero. And after outright inversion, the S&P 500 has rallied an average 29% to the equity peak. Moreover, after the last two years (1984 and 1994) that saw a flat to range-bound market against a backdrop of strong earnings, economic growth and P/E compression, the market gained 26% and 35%, respectively, the following year. So why all the worry?
On The One Hand
- The Consumer Price Index (CPI) rose 0.2% in May. The CPI is up 2.8% from a year ago.
- Retail sales rose 0.8% in May (up +1.0% including revisions to prior months), easily beating the consensus expected 0.4% gain. Retail sales are up 5.9% versus a year ago. Sales excluding autos increased 0.9% in May (up +1.1% including revisions to prior months).
- New jobless claims fell 4,000 to 218,000. Continuing claims declined 49,000 to 1.70 million, the lowest reading since late 1973 when the labor force was roughly half the size it is today.
- Total business inventories increased 0.3% in April after declining 0.1% in March. Total business sales increased 0.4% following the 0.6% increase in March.
- U.S. household confidence picked up in early June according to the University of Michigan’s consumer sentiment index which released a preliminary index value of 99.3, up from May’s final reading of 98.0.
On The Other Hand
- The Producer Price Index (PPI) rose 0.5% in May, well above the expectation of a 0.3% rise and the largest single-month increase in more than five years. The PPI is up 3.1% in the past year, the largest twelve-month increase since January of 2012.
- Both import and export prices rose 0.6% in May. In the past year, import prices are up 4.3%, while export prices have increased 4.9%, further evidence of the rising trend in inflation.
- Industrial production declined 0.1% in May. On the bright side, the decline followed the highest level on record with April’s revised increase of 0.9%. Capacity utilization declined to 77.9%.
All Else Being Equal
The Atlanta Fed’s GDPNow estimate for real Q2 GDP growth rose to 4.8%. The New York Fed Staff Nowcast stands at 3.0% for Q2 and 2.8% for Q3.
As was anticipated, the FOMC raised its fed funds range by 1/4% last week to 1.75% – 2.00%. The Fed is far from hawkish. Given the state of the U.S. economy, it is neutral at best and playing catch up based on the inflation data. With a target fed funds cap of 2% and inflation rates above this level, the real fed funds rate continues to be negative. The announcement did signal a slightly more aggressive stance by confirming the Fed’s intention to raise two more times before the end of the year.
Last Week’s Market

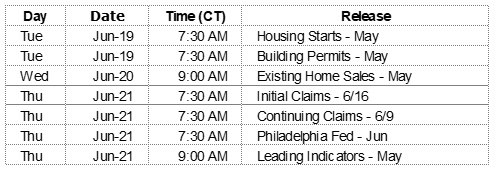
The Week Ahead
The information provided is obtained from sources believed to be reliable. Forecasts cannot be guaranteed. Past performance is not a guarantee of future results.