Stocks were higher again last week, for the 5th straight week in a row. The S&P 500 finished the week just 0.87% under its all-time high while the NASDAQ set new highs. Positive earnings reports have supported the strength in the S&P 500 with 75% of reporting companies in the index beating analysts’ estimates.
The 10-Year Treasury yield settled the week at 2.95% after a mid-week move to 3.00%.
On Wednesday, the Federal Open Market Committee left rates unchanged, which comes as no surprise as most expect the next Fed Funds rate increase to come during next month’s meeting.
On The One Hand
- Personal income rose 0.4% in June. Personal spending also rose 0.4%. On a 12-month basis, real disposable personal income was up 3.1% while real personal consumption expenditures were up 2.8%.
- The PCE Price Index was up 0.1% in June. Over the past 12 months, the PCE is up 2.2%.
- The Chicago PMI rose to 65.5 in July, up from 64.1 in June.
- The Conference Board’s Consumer Confidence Index rose to 127.4 for July, up from an upwardly revised 127.1 in June.
- Weekly initial unemployment claims remained below 300,000 for the 178th straight week at 218,000, an increase of 1,000. The four-week moving average for initial claims declined 3,500 to 214,500. Continuing claims declined by 23,000 to 1,724,000.
- Factory orders increased 0.7% in June following a 0.4% increase in May.
- Nonfarm payrolls rose 157,000 in July. Including the upward revisions totaling 59,000, made to the May and June reports, payrolls were up 216,000. Average hourly earnings (cash earnings, excluding irregular bonuses/commissions and fringe benefits) rose 0.3% in July and are up 2.7% versus a year ago. The unemployment rate dipped again to 3.9%.
On The Other Hand
- The ISM Manufacturing Index declined to 58.1% in July from 60.2% in June. While lower for the month, the index and all of its sub-indices remained above 50, which signals growth.
- Total construction spending declined 1.1% in June following May’s upwardly revised gain of 1.3%.
- U.S. light vehicle sales declined 2.8% in July, to a seasonally adjusted annual rate (SAAR) of 16.77 million units from June’s SAAR of 17.24 million units. Sales were only slightly lower than the SAAR of 16.78 million units in July 2017.
- The ISM’s Non-Manufacturing Index declined to 55.7% in July from 59.1% in June. On a positive note, the level continues comfortably above the 50.0% level, a sign of expansion.
All Else Being Equal
Nothing in this week’s reports will change the Fed’s path toward another one-quarter percent increase in the fed funds rate this September.
On trade, First Trust summarizes our thoughts very well:
We like to follow the total volume of trade – imports plus exports – which signals how much value consumers find in the global economy. Total US trade hit a new record all-time high in June.
We will continue to watch trade policy as it develops, but don’t see any reason yet to sound alarm bells.
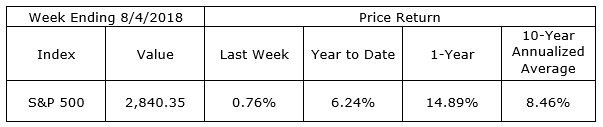
Last Week’s Market
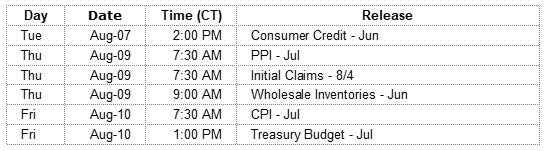
The Week Ahead
The information provided is obtained from sources believed to be reliable. Forecasts cannot be guaranteed. Past performance is not a guarantee of future results.