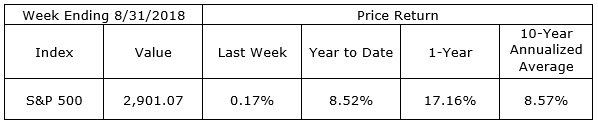
The S&P 500 rose to a new all-time high of 2,914.04 in the middle of the final week of August. The index finished the month 3.03% higher. August was the fifth month in a row during which the index closed higher and, since the end of the first quarter, the price gain is 9.87% higher. The large cap stocks were not alone. The NASDAQ Composite also traded to a record high of 8,109.69, closed up 5.71% in August, and finished the month 14.81% higher than its March 31 close. So much for the seasonal traders’ rule, “sell in May and go away.”
Interest rate markets were arguably part of the reason for the positive sentiment in the equity markets so far this year. The year began with considerable anxiety over sharply rising interest rates and fears of yield inversion (short-term rates greater than long-term rates), which would traditionally signal an end to the economic expansion. Rates have risen this year, but they remain well under the 5% level many were predicting. With the tightening in monetary policy yield, spreads have narrowed, but have not inverted.
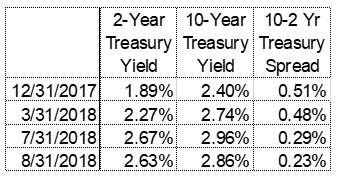
To date the 10-Year Treasury yield has not moved above 3% and the 10-2 spread has held at a positive 20 basis points. These relatively positive developments in interest rate levels have likely left investors with a more positive outlook for the economy and corporate profits than the outlook they had at the beginning of the year.
On The One Hand
- Retail sales rose 0.5% in July and are up 6.4% versus a year ago.
- Industrial production rose 0.1% in July and would be up 0.3% if revisions to prior months were included. Overall capacity utilization remained unchanged at 78.1% in July. Manufacturing capacity utilization increased to 75.9% in July from 75.7% in June.
- Real GDP was revised to a 4.2% annual growth rate in Q2 from a prior estimate of 4.1%.
- Personal income rose 0.3% in July. Personal consumption increased 0.4% in July. Personal income is up 4.7% in the past year, while spending is up 5.2%.
- Initial unemployment claims were reported at 213,000 and the 4-week moving average declined to 212,000, its lowest level since December 1969. Continuing claims declined 20,000 to 1.708 million.
On The Other Hand
- Housing starts increased 0.9% in July to a 1.168 million annual rate, well below the consensus expected 1.260 million. Starts are down 1.4% versus a year ago.
- Existing home sales declined 0.7% in July to a 5.34 million annual rate, below the consensus expected 5.40 million. Sales are down 1.5% versus a year ago.
- New single-family home sales declined 1.7% in July to a 627,000 annual rate, below the consensus expected 645,000. Sales are up 12.8% from a year ago.
- New orders for durable goods declined 1.7% in July and were down 1.8%, if revisions to prior months are included.
All Else Being Equal
Fed Chairman Jerome Powell recently confirmed that the FOMC is monitoring not only inflation, but also looking for signs of financial market excesses, as it continues its current path of gradually raising interest rates.
The Atlanta Fed GDPNow forecast stands at 4.1%, while the New York Fed Nowcast for our current quarter’s real GDP growth rate came in at 2.0%.
Last Week’s Market
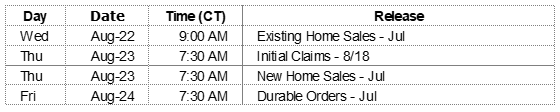
The Week Ahead
The information provided is obtained from sources believed to be reliable. Forecasts cannot be guaranteed. Past performance is not a guarantee of future results.