Why do we constantly hear about investment time-horizons? Because, as the old saying goes, time in the market is a consistently effective approach to investing while timing the market is not a dependable strategy. It is impossible to know what the market is going to do. We can’t even agree on what the market has done in the recent past.
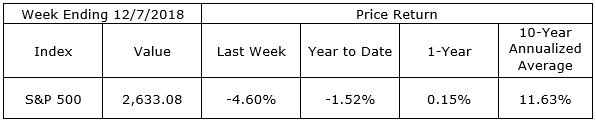
The S&P 500 closed last week at 2,633.08. An investor who checks the market religiously every other Friday, no more, no less, would find the index was roughly unchanged from its closing price of 2,632.56 two weeks ago on Friday, November 23. Over that time frame, it appears little has happened. The market has moved sideways.
The investor who regularly listens to the financial news and checks the movement of the market more frequently would disagree. He or she knows the market did not move sleepily sideways over the last two weeks and would point out the market has been quite volatile and was in fact down 10.16% over the time frame beginning September 20th when the index closed at its historic high of 2,930.75. While it is not unusual for historic highs to be followed by periods of correction, anxiety does, nevertheless, set in for many investors who too often turn into frightened market timers when normal 10% and 15% declines occur.
There is another type of investor who does not focus on such short time horizons. Investors with time in the market, focus on their time-horizons rather than weekly and monthly periods. Such investors might point to the S&P 500 gain over the last two years which has averaged more than 8% per year and this excludes dividends.
This morning, a well-known and highly respected hedge fund owner predicted the market would be both 10% down and 10% up and maybe 15% either way. He was not clear on which would come first. Armed with this guidance, it will be best to remain in the market with high quality securities, planning on taking advantage of any future declines by buying, whenever stocks “go on sale”. Over the multi-decade time horizons most of us have for at least portions of our investment portfolios, remaining in the market will produce the best results.
On the One Hand
- The ISM Manufacturing Index rose to 59.3 in November, easily beating the consensus expected 57.5 and rising from the October level of 57.7. The new orders index jumped to 62.1 from 57.4 in October and the prices paid index fell to 60.7 in November from 71.6 in October.
- Third quarter productivity was revised upward by 0.1% to 2.3%.
- Initial unemployment claims declined by 4,000 to 231,000. The four-week moving average for initial claims increased by 4,250 to 228,000. Continuing claims for the week ending November 24 declined by 74,000 to 1.631 million. There is no evidence of a reversal in the tight labor market data.
- Service sector growth continues to be strong with the November ISM Services index coming in at 60.7, the second highest reading in more than a decade following October’s reading of 60.3 and September’s recent high of 61.6.
- While slower than the average over the past year and below the expectations of pundits, the volatile monthly nonfarm payrolls report showed an increase of 155,000 jobs in November. Including the negative revisions to September and October, nonfarm payrolls increased 143,000. Civilian employment, a measure of jobs which includes small-business start-ups, rose 233,000 in November. This increase combined with an increase in the labor force of 133,000 was responsible for holding the jobless rate unchanged at 3.7%. Average hourly earnings rose 0.2% in November and are up 3.1% versus a year ago. The average workweek was 34.4 hours versus 34.5 hours in October. The average manufacturing workweek was unchanged at 40.8 hours and factory overtime also remained unchanged at 3.5 hours. The labor force participation rate was flat at 62.9%.
On the Other Hand
- Construction spending declined 0.1% in October and including revisions to prior months was down 1.5%. Private construction spending was down 0.4% and public construction spending increased 0.8%. Year-over-year, total construction spending was up 4.9% in October, with residential spending up 1.7% and nonresidential spending up 7.3%.
- Factory orders declined 2.1% in October. Adding in revisions to previous months orders, October is down 2.6%. Excluding transportation orders would result in an increase of 0.3%.
All Else Being Equal
Brian Wesbury, Chief Economist at First Trust is worth quoting again this week with his insights on trade (emphasis is mine):
Trade data have received extra attention of late from pundits looking to play up trade war impacts, but too often they end up missing the forest for the trees. Yes, the trade deficit widened in October to $55.5 billion as imports rose, while exports declined slightly. But what matters more than the headline trade deficit number – and which you will not hear about as much – is the total volume of trade – imports plus exports – which signals how much businesses and consumers interact across borders. Looking at that data, US trade hit a new record all-time high in October – the opposite of what we would expect in a trade war. In terms of the trade deficit in October, exports fell by $0.3 billion, while imports rose by $0.6 billion. Overall, in the past year exports are up 6.3%, while imports are up 8.5%, signaling very healthy gains in the overall volume of international trade and easily outstripping the pace of nominal GDP growth. While many are worried about protectionism from Washington, especially regarding China, we continue to think this is a trade skirmish, and the odds of an all-out trade war that noticeably hurts the US economy are slim. We believe better trade agreements for the United States and world are on the way. We have already seen it happen with several countries, and now China looks to be extending a bit of an olive branch, too. Average tariffs in China will be cut from 9.8% last year to 7.5% this year and on Tuesday, China released a 58-page document showing an array of punishments for IP theft moving forward. We see this as real progress, and just the start. The US’s negotiating position simply continues to strengthen, in no small part due to the rise of the US as an energy powerhouse. As recently as 2005, the US was importing more than ten times the petroleum products that we were exporting. As of October, imports are down to 1.2 times exports and this trend should continue. Not only does this reduce US reliance on foreign trade partners and lower their bargaining power, it has served to shift power dynamics on a global scale (witness the political turmoil in Saudi Arabia). So at the end of the day, we will continue to watch trade policy as it develops, but don’t see any reason to sound alarm bells.
Last Week’s Market
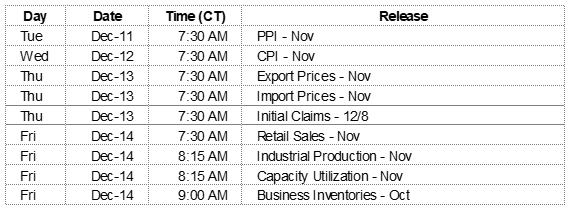
The Week Ahead
The information provided is obtained from sources believed to be reliable. Forecasts cannot be guaranteed. Past performance is not a guarantee of future results.