Markets were relatively flat last week, going into the weekend’s G-20 Summit in Osaka, Japan. Little detail emerged from the summit, other than announcements of the resumption of trade negotiations which had stalled. The welcome restart of negotiations still leaves us a long way from resolution which will likely take years. The best we can hope for in the near term is a halt to spiraling tariffs which would slow global trade and hurt everyone.
The markets over the past few years have not consistently displayed their normal season trends. For example, the old “sell in May” advice, if followed, would have left one out of the market during the best June we have had in over five decades. As we move through summer however, it would be nice to experience some summer market stagnation in order to allow investors to digest the volatility we have experienced over the last three quarters.
Your financial plan is not seasonal. Stick with your goals and your process.
On the One Hand
- The third estimate for Q1 GDP growth was unchanged at 3.1%. The GDP Price Deflator was up 0.9%, slightly higher than the 0.8% reported in the second estimate. Nominal GDP growth was therefore revised higher to 3.8% at an annual rate from the prior estimate of 3.6%. Versus a year ago, nominal GDP is up 5.1%.
- Pending home sales rose 1.1% in May, suggesting an increase in closings in June.
- Strength in income and spending continued in May, on the back of a strong report in April which was revised even higher. Personal income rose 0.5% in May. Spending rose 0.4% in May, following the 1.0% increase in March and a 0.6% increase in April. The 8.3% annualized growth in spending over the past three months is the fastest pace we have seen since late 2009. Personal income is up 4.1% in the past year.
On the Other Hand
- Strength in income and spending continued in May, on the back of a strong report in April which was revised even higher. Personal income rose 0.5% in May. Spending rose 0.4% in May, following the 1.0% increase in March and a 0.6% increase in April. The 8.3% annualized growth in spending over the past three months is the fastest pace we have seen since late 2009. Personal income is up 4.1% in the past year.
- The Consumer Confidence Index fell to 121.5 in June from a downwardly revised 131.3 in May.
- Total durable goods orders were down 1.3% in May following the 2.8% decline in April. Beneath the headline, orders, excluding transportation, rose 0.3% following April’s decline of 0.1%. In addition, shipments of nondefense capital goods, excluding aircraft, rose 0.7% in May and 0.4% in April and new orders for nondefense capital goods, excluding aircraft, rose 0.4% in May following a decline of 1.0% in April.
- Initial jobless claims increased by 10,000 to 227,000 and the 4-week moving average rose 250 to 219,000. Continuing claims for the week rose 22,000 to 1.688 million. The report was not a significant negative as claims remain well under 300,000 and have been for 225 consecutive weeks.
- The final June reading for the University of Michigan Index of Consumer Sentiment was set at 98.2 up slightly from the 97.9 preliminary reading. June sentiment remained down from the 100.0 notch reported in May.
All Else Being Equal
The aging housing stock in the U.S. along with current population trends leaves new home sales well below normal levels. Employment levels, rising wages, moderating housing price inflation and lower mortgage rates have the stage set for at least a slight rebound in new home sales as the year progresses.
Last Week’s Market

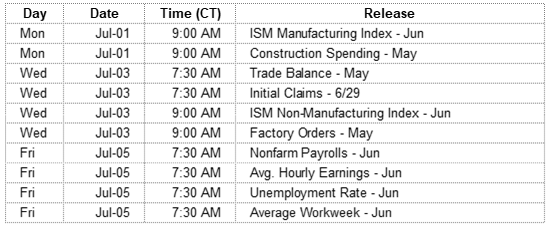
The Week Ahead

The information provided is obtained from sources believed to be reliable. Forecasts cannot be guaranteed. Past performance is not a guarantee of future results.