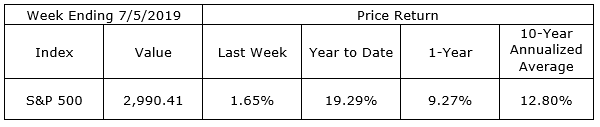
The S&P 500 was up 1.65% last week, leaving the index up 19.29% year-to-date. Due to the sharp runup, we began reducing equity allocations several weeks ago and have trimmed our overweight position in equities by two percentage points. We are planning another round of reductions in the coming weeks which will amount to as much as another two percent. While keeping equity allocations at or slightly above neutral, we believe clients will benefit by these reductions in equity exposure and the stability of additions to money market allocations over the balance of the summer.
U.S. economic data continues to be net positive, driven primarily by job and wage growth. While jobs growth in construction and manufacturing are picking up, the output data for construction and manufacturing remains spotty. Adding in the volatile announcements from the media about the ongoing trade negotiations, we sense investors are uneasy about the short-term prospects for the economy and market. Barring a trade shock of some sort, we still see little chance of recession in the next twelve months and believe many of the stocks of companies with strong balance sheets and cash flows remain fairly-priced at worst and undervalued in some instances.
Second quarter corporate earnings will begin to trickle out this week and begin to flow heavily throughout the remaining weeks of July. Investors should be expecting a 1% decline in S&P 500 earnings per share for Q2. Traders will be focusing on corporate outlooks for the balance of the year and into 2020.
On the One Hand
- Initial unemployment claims declined by 8,000 to 221,000, putting the four-week moving average at 222,250. Continuing claims declined by 8,000 to 1.686 million.
- The headline for the trade balance report noted the deficit rose to $55.5 billion. Although the more significant gain was in total trade volume, imports plus exports, which took place across U.S. borders. Total trade rose $12.7 billion to $476.8 billion. May exports were $4.2 billion higher than the previous month and imports in the most recent months were $8.5 billion more than April imports.
- The payroll report showed a gain of 224,000 jobs in June. In the past year, payrolls are up an average of 192,000 per month. The unemployment rate ticked up to 3.7% in June from 3.6% in May, partly due to a similar uptick in the labor force participation rate to 62.9% from 62.8% in May. Average hourly earnings rose 0.2% in June and hours worked rose 0.2%, as well. As a result, total wages are up 4.6% in the past year.
On the Other Hand
- The ISM Manufacturing Index declined to 51.7 in June but remained above the expansion/contraction dividing line at 50.0. The major sub-indexes were mixed in June, but all stand at or above 50, with the new orders index at 50.0, the supplier deliveries index at 50.7, the production index at 54.1, and the employment index at 54.5.
- Total construction spending declined 0.8% in May following an upwardly revised 0.4% increase in April. Total construction spending was down 2.3% versus one year ago.
- The rate of growth in the service sector slowed in June, with the headline index falling to its lowest level in nearly two years. The ISM Non-Manufacturing Index dropped to 55.1% in June from 56.9% in May.
- Factory orders continued their slump, declining 0.7% in May following the downwardly revised April decline of 1.2% from the initially reported -0.8%.
All Else Being Equal
The headlines have made note of the current economic expansion being the longest in U.S. history. This is true in terms of its length but in terms of its breadth, it has lagged significantly and therefore, may not be anywhere near recession. Linda Duessel, Senior Vice President and Senior Equity Strategist at Federated Investors recently noted, “Industrial production is up 25.8% since June 2009 through May of this year, about a third of the record post-WWII increase of 75% from February 1961 to December 1969 and well short of the 32% average increase during the previous 11 expansions. Similarly, the 25% increase in real GDP from Q2-2009 through Q1-2019 is the second-weakest 10-year performance compared to the previous six 10-year periods that started with expansions, Yardeni Research notes. In other words, because there has been no boom, the economy has not set itself up for a bust, a point I have made many times in my speeches. On the other hand, this expansion has seen a 65% increase in real capital spending, beating two of the previous 10-year periods and demolishing the myth promoted by the naysayers that capital spending in this cycle has been the worst ever.”
An interesting detail in last week’s employment report is worth noting. The share of voluntary job leavers among the unemployed jumped up to 14.7%, the highest since 2000. When such a large share of the unemployed leave their previous job voluntarily, it shows a great deal of confidence in the labor market and little fear of recession.
Last Week’s Market
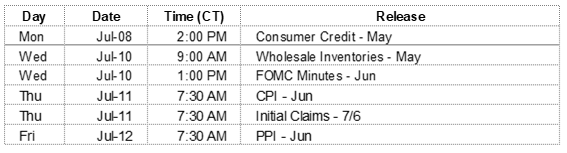
The Week Ahead
The information provided is obtained from sources believed to be reliable. Forecasts cannot be guaranteed. Past performance is not a guarantee of future results.