After moving lower, down 5.00% or more intraday Wednesday, stocks rebounded in the last half of the week to finish the week mixed. The DJ Industrial Average ended the week down 0.92%, the S&P 500 finished 0.33% lower and the NASDAQ was up with a gain of 0.54%. Interest rates edged lower throughout the week, leaving the 2-Year Treasury yield at 1.40%, a level not seen since September 2017.
This week will start fresh rounds of negotiations on several fronts. Vice Premier Liu will be in Washington this week to lead talks on trade. Brexit negotiations will heat up again as the October 31 deadline approaches. Fed governors will be in the news providing their interpretations of the latest economic data ahead of the next FOMC rate decision meeting later this month.
This week will also be the start of Q3 earnings announcements and full year forecasts. The trickle of reports this week will turn into a flood of announcements as the month progresses. Current expectations are for aggregate earnings of S&P 500 companies to be 3.6% below last year’s hard-to-beat numbers.
There will be plenty of economic headlines to trigger equity and fixed income market volatility in the coming weeks. Investors must focus on the data and tune out the conflicting narratives.
On the One Hand
- Initial unemployment claims continued far below 300,000 with an increase of 4,000 to 219,000. The four-week moving average for initial claims was unchanged at 212,500. Continuing claims declined by 5,000 to 1,651,000.
- September nonfarm payrolls increased by 136,000 and revisions to the prior two months added an additional 45,000 jobs. The unemployment rate dropped to 3.5%. Average hourly earnings were flat for the month at an annual growth rate of 2.9%. The average workweek was also flat at 34.4 hours.
On the Other Hand
- Negative trade related sentiment helped push the ISM manufacturing index to its lowest level in ten years. The ISM Manufacturing Index declined deeper into contraction territory to 47.8 in September, down from 49.1 in August.
- Total construction spending rose just 0.1% in August following an unchanged reading for July, which was revised downward by 0.1%. Private construction spending is down 4% for the year.
- Factory Orders for August declined 0.1% following the July increase of 1.4%. Shipments were down 0.1% following the July decline of 0.3%.
- The ISM Non-Manufacturing index fell from 56.4 in August to 52.6 in September. While the reading above 50.0 indicates the segment continues in expansion mode, the rate of expansion has obviously decelerated leaving the services index at its lowest level since August 2016.
- The U.S. trade deficit grew from $54 billion to $54.9 billion in August. Total U.S. trade grew just 0.4% to $470.7 billion.
All Else Being Equal
The negative effects of the slowing foreign economies and the trade disputes continue to show up in the U.S. manufacturing data. The service sector, which is 80% of U.S. GDP is slowing but remains in expansion mode. Continued strong employment data supports expectations of continued healthy consumer spending which drives 68% of U.S. GDP.
Slowing growth, not recession, is evident in the latest data as the Atlanta Fed staff has taken its estimate for real Q3 GDP growth back under 2.0% to 1.8%.
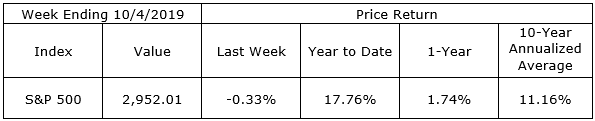
Last Week’s Market
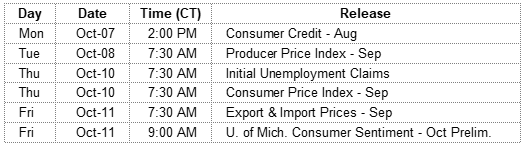
The Week Ahead
The information provided is obtained from sources believed to be reliable. Forecasts cannot be guaranteed. Past performance is not a guarantee of future results.