Increasing prospects that a massive fiscal stimulus bill is around the corner helped drive stocks to record highs last Monday. With fourth-quarter corporate earnings season at the halfway mark, 83% of the reporting companies have surpassed most estimates, a clear sign that the economy is slowly turning the corner toward recovery. The S&P 500 jumped 0.7% to a record high, while the small caps of the Russell 2000 climbed 2.5%. The Global Dow advanced 1.1%, the Nasdaq gained 1.0%, and the Dow added 0.8%. Energy continued to soar, gaining 4.2%, followed by financials and information technology as the only other sectors increasing by at least 1.0%. Crude oil prices continued to advance, surging ahead by 2.1%, driven higher by growing economic optimism, the likelihood of additional stimulus, and President Biden’s reluctance to relax sanctions on Iran. Treasury yields fell as bond prices climbed. The dollar was mixed against a basket of currencies.
Stocks were mixed last Tuesday with the large caps of the Dow and the S&P 500 slipping for the first time in six sessions, while the Russell 2000, the Global Dow, and the Nasdaq posted gains. The market sectors were split with communication services, financials, health care, industrials, utilities, and real estate advancing, while consumer discretionary, consumer staples, energy, information technology, and materials fell. Crude oil prices are nearing $60 per barrel after rising again last Tuesday. Treasury yields and the dollar declined.
For the second consecutive day, stocks were mixed last Wednesday. The Dow gained 0.2% and the Global Dow jumped 0.4%. The S&P 500 was flat, while the Russell 2000 (-0.7%) and the Nasdaq (-0.3%) fell. Among the sectors, energy, communication services, real estate, utilities, and health care advanced. The yield on 10-year Treasuries declined, the dollar was mixed, and crude oil prices inched up 0.1%.
Last Thursday saw equities perform better. Information technology drove the Nasdaq up 0.4%, followed by the S&P 500 (0.2%) and the Russell 2000 (0.1%). The Global Dow dipped 0.1% and the Dow was flat. Treasury yields climbed over 2.0% and the dollar was mixed. Crude oil prices fell for the first time in quite a while, falling 1.2%. Most of the sectors lost value, led by energy, which dropped 1.6%.
Stocks closed the week on a high note last Friday. Each of the benchmark indexes gained value, led by the Nasdaq and the S&P 500, which each climbed 0.5%. The Global Dow advanced 0.4% on the day, followed by the Russell 2000 (0.2%) and the Dow (0.1%). Among the market sectors, only real estate and utilities fell. Energy and materials each advanced over 1.0% to lead the remaining sectors. Treasury yields jumped more than 3.6%, crude oil prices regained momentum, while the dollar was flat.
Overall, last week saw each of the benchmark indexes listed here advance by at least 1.0%. The Russell 2000 led the way, followed by the Global Dow, the Nasdaq, the S&P 500, and the Dow. Energy led the market sectors after climbing 4.4%, followed by information technology (2.3%) and financials (2.0%). Utilities (-1.8%), communication services (-1.4%), and consumer discretionary (-1.2%) fared poorly for the week. The Russell 2000 and the Nasdaq remained ahead of the remaining benchmarks year to date. Crude oil climbed 4.6% for the week and has increased 22.9% in 2021.
The national average retail price for regular gasoline was $2.461 per gallon on February 8, $0.052 per gallon over the prior week’s price and $0.042 higher than a year ago. Crude oil refinery inputs averaged 14.8 million barrels per day during the week ended February 5, which was 152,000 barrels per day more than the previous week’s average. Refineries operated at 83.0% of their operable capacity last week.
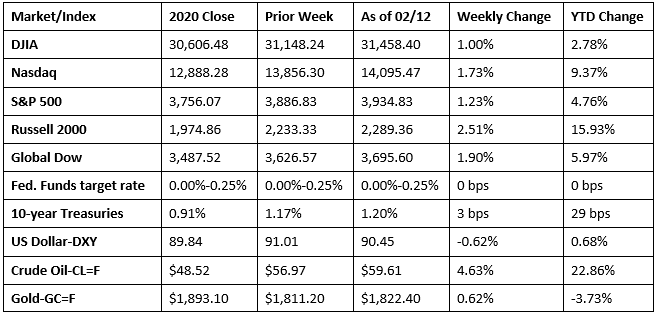
Chart reflects price changes, not total return. Because it does not include dividends or splits, it should not be used to benchmark performance of specific investments.
Last Week’s Economic News
- According to the latest Job Openings and Labor Turnover Summary, there were 6.6 million job openings in December, little changed from November’s total. The number of hires fell from 5.9 million in November to 5.5 million in December. Total separations in December, at 5.5 million, were essentially the same as in November.
- The Consumer Price Index increased 0.3% in January, however the index less food and energy was unchanged from the previous month. Driving the CPI was a 7.4% rise in gasoline prices in January. Food prices inched up 0.1%. The CPI rose 1.4% for the 12 months ended in January. The index increased 1.6% in 2020. Prices for new motor vehicles and used cars and trucks fell 0.5% and 0.9%, respectively. Prices for apparel rose 2.2% last month.
- The federal budget deficit was $162.8 billion in January, nearly five times greater than the deficit for January 2020. Last month, government receipts totaled $384.7 billion ($372.3 billion in January 2020), while the government spent $547.5 billion ($404.9 billion in January 2020). Through the first four months of the current fiscal year, the deficit sits at $735.7 billion, 89% higher than the deficit over the same period in the last fiscal year. Economic Impact Payments authorized by the Consolidated Appropriations Act of 2021 were a significant factor in the January deficit.
- For the week ended February 6, there were 793,000 new claims for unemployment insurance, a decrease of 19,000 from the previous week’s level, which was revised up by 33,000. According to the Department of Labor, the advance rate for insured unemployment claims was 3.2% for the week ended January 30, a decrease of 0.1 percentage point from the prior week’s revised rate. For comparison, during the same period last year, there were 204,000 initial claims for unemployment insurance, and the insured unemployment claims rate was 1.2%. The advance number of those receiving unemployment insurance benefits during the week ended January 30 was 4,545,000, a decrease of 145,000 from the prior week’s level, which was revised up by 98,000. States and territories with the highest insured unemployment rates in the week ended January 23 were in Pennsylvania (6.8%), Alaska (6.4%), Kansas (6.1%), Nevada (6.1%), Rhode Island (5.6%), Illinois (5.5%), Connecticut (5.4%), the Virgin Islands (5.4%), Massachusetts (5.3%), and New Mexico (5.2%). The largest increases in initial claims for the week ended January 30 were in California (+51,025), New York (+11,140), Florida (+6,322), Rhode Island (+4,684), and Pennsylvania (+3,844), while the largest decreases were in Illinois (-55,473), Kansas (-7,496), Mississippi (-3,107), Ohio (-2,181), and New Jersey (-2,156).
Eye on the Week Ahead
There’s plenty of relevant economic data out this week. The Producer Price Index and the retail sales report for January are available at the beginning of the week. Producer prices advanced 0.3% in December and increased only 0.8% in 2020. Retail sales are expected to rebound in January after falling 0.7% in December. The housing sector has been strong for several months and should show continued moxie in January.
The Week Ahead

The information provided is obtained from sources believed to be reliable. Forecasts cannot be guaranteed. Past performance is not a guarantee of future results.
© 2021 Broadridge Financial Solutions, Inc. All Rights Reserved.