Stocks opened last week mixed. Tech stocks surged, driving the Nasdaq to an all-time high. The S&P 500 inched ahead, while the Global Dow (-0.8%), the Russell 2000 (-0.5%), and the Dow (-0.4%) fell. Besides technology, other sectors performing well last Monday included communication services, utilities, and consumer discretionary. Energy, financials, and industrials dipped lower. Treasury yields and crude oil prices declined, while the dollar was mixed.
Equities pushed higher last Tuesday, despite talk of inflated equity values, maxed-out earnings growth, and the possible spread of another coronavirus strain. The Nasdaq, the Dow, and the S&P 500 eked out gains, while the Russell 2000 and the Global Dow fell. The yield on 10-year Treasuries inched higher, the dollar gained, and crude oil prices climbed past $73.40 per barrel. Among the market sectors, information technology, consumer discretionary, and health care advanced. Utilities declined more than 1.6%.
Stocks closed last Wednesday mixed, with the Dow, the S&P 500, and the Russell 2000 inching higher, while the Global Dow and the Nasdaq dipped slightly lower. Value, energy, and cyclical stocks led, while technology and growth shares fell. Treasury yields slid, while the dollar and crude oil prices advanced.
Equities kicked off the second half of the year on a positive note last Thursday. The S&P 500 gained 0.5% to reach a new closing high for the 35th time this year. The Russell 2000 reversed course from the past three sessions to post a solid 0.8% gain. The Dow (0.4%), the Global Dow (0.5%), and the Nasdaq (0.1%) also closed higher. Nearly all of the market sectors advanced, led by energy, utilities, and communication services. Only consumer staples dipped lower. Treasury yields, the dollar, and crude oil prices advanced.
A strong jobs report helped drive stocks higher last Friday. The S&P 500 advanced for the seventh straight session — the longest run since August 2020. The Nasdaq closed the day reaching another record high, the Dow and the Global Dow rose, while the Russell 2000 dipped lower. Treasury yields, the dollar, and crude oil prices fell. Information technology, consumer discretionary, communication services, and health care led the sectors.
Stocks ended last week generally higher, with the Nasdaq, the S&P 500, and the Dow each climbing more than 1.0%, while the Russell 2000 and the Global Dow lost value. Information technology added 3.2% to lead the sectors, followed by consumer discretionary, health care, and communication services. Crude oil prices rose again, ending the week at $75.20 per barrel. The dollar inched higher, while the yield on 10-year Treasuries fell.
The national average retail price for regular gasoline was $3.091 per gallon on June 28, $0.031 per gallon higher than the prior week’s price and $0.917 more than a year ago. Gasoline production decreased during the week of June 25, averaging 9.6 million barrels per day, down from the prior week’s average of 10.3 million barrels per day. U.S. crude oil refinery inputs averaged 16.3 million barrels per day during the week ended June 25; this was 187,000 barrels per day more than the previous week’s average. For the week ended June 25, refineries operated at 92.9% of their operable capacity, up from the prior week’s level of 92.2%.
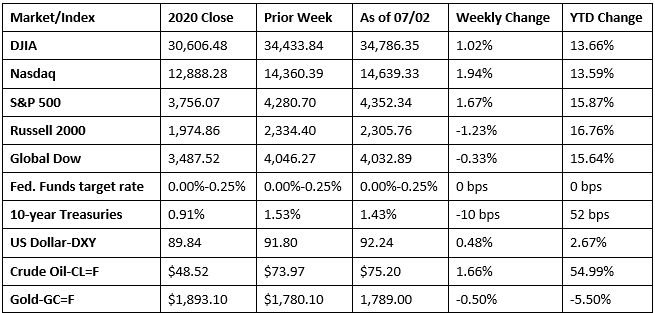
Chart reflects price changes, not total return. Because it does not include dividends or splits, it should not be used to benchmark performance of specific investments.
Last Week’s Economic News
- Employment increased by 850,000 jobs in June following May’s upwardly revised total of 583,000. Overall, 1.7 million new jobs were added over the second quarter of 2021. Nevertheless, employment is down by 6.8 million, or 4.4%, from its pre-pandemic level in February 2020. Notable job gains occurred in leisure and hospitality, public and private education, professional and business services, and retail trade. The unemployment rate ticked up 0.1 percentage point in June to 5.9%, and the number of unemployed persons increased by roughly 168,000 to 9.5 million. Both measures are considerably lower than their recent highs in April 2020, but remain well above their levels prior to the COVID-19 pandemic of 3.5% and 5.7 million, respectively. Among the unemployed, the number of job leavers — that is, unemployed persons who quit or voluntarily left their previous job and began looking for new employment — increased by 164,000 to 942,000 in June. The labor force participation rate was unchanged at 61.6% in June but is 1.7 percentage point lower than in February 2020. The employment-population ratio, at 58.0%, was also unchanged in June but is 3.1 percentage points below its February 2020 level. In June, 14.4% of employed persons teleworked because of the pandemic, down from 16.6% in the prior month. Last month, 6.2 million persons reported that they had been unable to work because their employer closed or lost business due to the pandemic — down from 7.9 million in May. Average hourly earnings rose by $0.10 to $30.40 in June and have increased 3.6% from June 2020. The average work week dipped from 34.9 hours in May to 34.7 hours in June.
- The IHS Markit U.S. Manufacturing Purchasing Managers’ Index™ registered 62.1 in June, unchanged from May. New orders increased in June. The pace of increase was the second-fastest on record, with firms continuing to note marked upturns in demand from both new and existing clients. Survey respondents suggested that the primary hindrance to further output growth was ongoing supply-chain disruptions and some labor shortages. Selling prices continued to grow higher as input costs were passed on to clients.
- The latest information on international trade of goods and services shows that the trade deficit increased by 3.1% in May to $71.2 billion. In May, exports increased by 0.6% and imports rose by 1.3%. Year to date, the goods and services deficit increased $110.9 billion, or 45.8%, from the same period in 2020.
- For the week ended June 26, there were 364,000 new claims for unemployment insurance, a decrease of 51,000 from the previous week’s level, which was revised up by 4,000. This is the lowest level for initial claims since March 14, 2020, when it was 256,000. According to the Department of Labor, the advance rate for insured unemployment claims for the week ended June 19 was 2.5%, unchanged from the previous week’s revised rate. The advance number of those receiving unemployment insurance benefits during the week ended June 19 was 3,469,000, an increase of 56,000 from the prior week’s level, which was revised up by 23,000. For comparison, during the same period last year, there were 1,436,000 initial claims for unemployment insurance, and the insured unemployment claims rate was 12.2%. During the last week of February 2020 (pre-pandemic), there were 219,000 initial claims for unemployment insurance, and the number of those receiving unemployment insurance benefits was 1,724,000. States and territories with the highest insured unemployment rates in the week ended June 12 were in Rhode Island (5.1%), Nevada (4.4%), Puerto Rico (3.9%), Connecticut (3.8%), California (3.6%), Illinois (3.6%), Alaska (3.4%), New York (3.4%), Pennsylvania (3.3%), and the District of Columbia (3.2%). The largest increases in initial claims for the week ended June 19 were in Pennsylvania (+14,715), Michigan (+1,862), and Texas (+1,814), while the largest decreases were in Illinois (-4,762), California (-4,112), Ohio (-2,955), Florida (-2,229), and Georgia (-1,826).
Eye on the Week Ahead
The holiday-shortened week does not offer much for economic data, and market trading should be relatively slow. Investors may be interested in progress made on the bipartisan infrastructure legislation, while the minutes from the last Federal Open Market Committee meeting are available, which should shed a little more light on committee members’ opinions relative to inflation, interest rates, and stimulus.
The Week Ahead

The information provided is obtained from sources believed to be reliable. Forecasts cannot be guaranteed. Past performance is not a guarantee of future results.
© 2021 Broadridge Financial Solutions, Inc. All Rights Reserved.