Stocks suffered their worst week in quite some time, as each of the major indexes ended the week lower. Last week was the start of the second-quarter corporate earnings reporting period. Attention will be paid to reported earnings to gauge whether corporate profits can support equity valuations. Despite Fed Chair Jerome Powell’s repeated statements that the recent spike in inflation is temporary, last week’s rise in the Consumer Price Index and the Producer Price Index are likely to add fuel to the debate about the timing of the Federal Reserve’s stimulus reduction.
Equities edged higher to begin the week, with financials, communication services, and real estate leading the sectors, while consumer staples, industrials, and information technology lagged. Investors traded cautiously last Monday ahead of the release of second-quarter earnings and inflation data later in the week. The Global Dow led the benchmark indexes, climbing 0.5%, followed by the large caps of the Dow and the S&P 500, which each gained 0.4%. Treasury yields and the dollar advanced, while crude oil prices declined.
Stock values retreated and bond yields increased last Tuesday as investors seemed to weigh whether rising inflationary pressures will prompt the central bank to begin rolling back stimulus sooner rather than later. The small caps of the Russell 2000 fell the furthest, declining 1.9%. The Global Dow dropped 0.6%, the Nasdaq and the S&P 500 lost 0.4%, while the Dow fell 0.3%. The yield on 10-year Treasuries rose 3.9%, the dollar gained 0.6%, and crude oil prices increased 1.7% to $75.32 per barrel. Among the market sectors, only information technology advanced, gaining 0.4%. Real estate, materials, industrials, financials, and consumer discretionary fell by at least 1.0%.
Growth stocks outperformed value shares in a day of mixed results last Wednesday. Consumer staples, information technology, real estate, and utilities led the sectors. The Russell 2000 continued to lag, dropping 1.6% by the close of trading. Treasury yields fell as bond prices rose following reassuring comments from Fed Chair Jerome Powell, who suggested that stimulus measures are likely to remain for some time. The dollar was little changed, while crude oil prices declined.
The Dow, which inched ahead 0.2%, was the only benchmark index to post a gain last Thursday. Information technology shares lagged, pulling the Nasdaq down 0.7%. The Russell 2000 (-0.6%) declined for the third straight session, the Global Dow dipped 0.4%, and the S&P 500 inched down 0.3%. Treasury yields on 10-year bonds dropped to 1.3%. The dollar advanced, while crude oil prices decreased to $71.55 per barrel. Among the market sectors, only consumer discretionary, industrials, materials, real estate, and utilities advanced marginally.
Stocks tumbled lower last Friday as each of the benchmark indexes lost value. The Russell 2000 fell 1.2% on Friday. The Global Dow dipped 1.0%, while the large caps of the Dow (-0.9%) and the S&P 500 (-0.8%) also lost value. Tech shares fell 1.0%, dragging the Nasdaq down 0.8% for the day. The yield on 10-year Treasuries and the dollar inched higher, while crude oil prices fell marginally. Most of the market sectors dropped, with energy (-3.0%), materials (-1.6%), and financials (-1.5%) declining the most.
For the week, the Russell 2000 sank 5.1%, followed by the Nasdaq, the Global Dow, the S&P 500, and the Dow. Crude oil prices decreased for the second consecutive week, but are still 47.3% above their 2020 year-end price per barrel. The yield on 10-year Treasuries decreased 5 basis points, the dollar increased 0.67%, and gold prices increased marginally. The market sectors closed the week with mixed returns. Consumer staples (1.3%), utilities (2.6%), and real estate (0.7%) were the only sectors to advance. The remaining sectors decreased, led by energy (-7.7%) and materials (-2.4%).
The national average retail price for regular gasoline was $3.133 per gallon on July 12, $0.011 per gallon higher than the prior week’s price and $0.038 more than a year ago. Gasoline production decreased during the week of July 12, averaging 9.9 million barrels per day, down from the prior week’s average of 10.6 million barrels per day. U.S. crude oil refinery inputs averaged 16.1 million barrels per day during the week ended July 9; this was 22,000 barrels per day less than the previous week’s average. For the week ended July 12, refineries operated at 91.8% of their operable capacity, down from the prior week’s level of 92.2%.
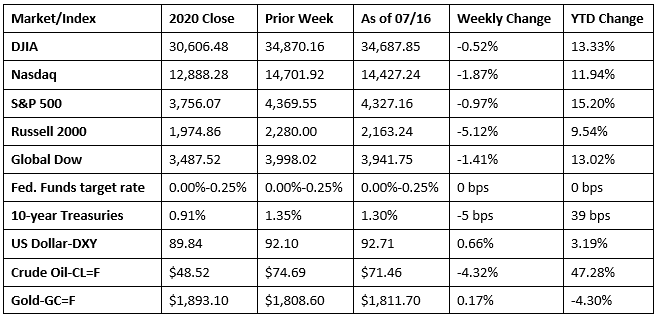
Chart reflects price changes, not total return. Because it does not include dividends or splits, it should not be used to benchmark performance of specific investments.
Last Week’s Economic News
- Consumer prices have now risen 5.4% over the past 12 months after advancing 0.9% in June. According to the latest Consumer Price Index, the June increase was the largest one-month change since June 2008, when the index rose 1.0%. Prices for used cars and trucks continued to rise sharply, increasing 10.5% in June, which accounted for more than one-third of the overall June price increase. Last month, food prices increased 0.8% and energy prices rose 1.5%, with gasoline prices climbing 2.5%. Except for a dip in May, the CPI has increased month-over-month since January. Prices less food and energy rose 4.5% over the last 12 months, the largest 12-month increase since the period ended November 1991. Over the last 12 months, energy prices have risen 24.5% and food prices have increased 2.4%.
- Producer prices climbed 1.0% in June following increases of 0.8% in May and 0.6% in April. For the 12 months ended in June, producer prices have increased 7.3% — the largest advance since 12-month data was first calculated in November 2010. In June, prices for services rose 0.8% and prices for goods moved up 1.2%. Producer prices less foods, energy, and trade services advanced 0.5% in June and have risen 5.5% since June 2020, which is the largest 12-month increase since August 2014. Margins for trade services, which measure changes in margins received by wholesalers and retailers, jumped 2.1%, representing 70% of the June increase in prices for services. Wholesalers, faced with rising commodity prices and increased labor costs due to a shortage of willing workers, are boosting prices charged to retailers. As the economy continues to recover, increasing demand for goods and services has put a strain on inventories. Producers, faced with increased wholesale costs and low supply, are passing on the higher cost to consumers.
- In another sign of mounting inflationary pressures, both import and export prices advanced in June. Import prices rose 1.0% last month following a 1.4% jump in May. Export prices increased 1.2% in June after advancing 2.2% the previous month. Prices for imports rose 11.2% for the year ended in June. Fuel import prices advanced 4.7% in June. Nonfuel import prices rose 0.7%. Prices for exports increased 16.8% from June 2020 to June 2021. Agricultural exports advanced 1.5% last month and have not recorded a monthly decline since August 2020. Nonagricultural export prices increased 1.1% in June, driven higher by rising prices for industrial supplies and materials, capital goods, consumer goods, automotive vehicles, and nonagricultural foods.
- Retail sales increased 0.6% in June following May’s revised -1.7% dip. Retail sales are 18.0% above their June 2020 pace. Retail trade sales were up 0.3% from May 2021, and 15.6% above last year. Clothing and clothing accessories stores were up 2.6% in June and 47.1% from June 2020, while food services and drinking places were up 2.3% last month and 40.2% over June 2020.
- According to the latest report from the Federal Reserve, industrial production increased 0.4% in June after moving up 0.7% in May. In June, manufacturing output edged down 0.1%, as an ongoing shortage of semiconductors contributed to a decrease in the production of motor vehicles and parts. Excluding motor vehicles and parts, factory output increased 0.4%. The output of utilities advanced 2.7%, reflecting heightened demand for air conditioning, as much of the country experienced a heat wave in June. The index for mining increased 1.4%. Overall, total industrial production in June was 9.8% above its year-earlier level but 1.2% below its pre-pandemic (February 2020) level.
- The government budget deficit was $174.2 billion in June, a 32.0% increase over the May deficit but 80.0% lower than the pandemic-impacted June 2020 deficit. Over the first nine months of the fiscal year, the deficit is $2.2 trillion, 18.0% lower than the deficit over the same period last fiscal year. So far in fiscal year 2021, receipts are up 35.0%, while government expenditures dipped 6.0%. Individual income tax receipts have risen 62.0% in fiscal year 2021, and corporate income taxes are up 188.0%.
- For the week ended July 10, there were 360,000 new claims for unemployment insurance, a decrease of 26,000 from the previous week’s level, which was revised up by 13,000. This is the lowest level for initial claims since March 14, 2020, when it was 256,000. According to the Department of Labor, the advance rate for insured unemployment claims for the week ended July 3 was 2.4%, unchanged from the previous week’s rate. The advance number of those receiving unemployment insurance benefits during the week ended July 3 was 3,241,000, a decrease of 126,000 from the prior week’s level, which was revised up by 28,000. This is the lowest level for insured unemployment since March 21, 2020, when it was 3,094,000. For comparison, during the same period last year, there were 1,479,000 initial claims for unemployment insurance, and the insured unemployment claims rate was 11.9%. During the last week of February 2020 (pre-pandemic), there were 219,000 initial claims for unemployment insurance, and the number of those receiving unemployment insurance benefits was 1,724,000. States and territories with the highest insured unemployment rates in the week ended June 26 were in Puerto Rico (4.8%), Nevada (4.3%), Georgia (4.2%), Rhode Island (4.2%), Connecticut (4.0%), California (3.6%), Illinois (3.5%), New Jersey (3.5%), Pennsylvania (3.4%), and New York (3.3%). The largest increases in initial claims for the week ended July 3 were in Puerto Rico (+6,722), Pennsylvania (+5,296), New York (+4,730), Texas (+4,645), and California (+2,588), while the largest decreases were in Oklahoma (-2,461), Massachusetts (-1,778), Washington (-1,596), Connecticut (-1,563), and Virginia (-1,371).
Eye on the Week Ahead
The latest data on housing starts and existing home sales is available this week. While the housing sector has been an area of strength throughout much of the past year, it has begun to slow over the past few months. The number of building permits and housing completions fell in May, while housing starts increased. Existing home sales also fell in May, the fourth consecutive monthly decline. Analysts suggest that activity in the housing sector is approaching pre-pandemic activity levels. A lack of available inventory and escalating prices are prominent factors in holding back sales.
The Week Ahead

The information provided is obtained from sources believed to be reliable. Forecasts cannot be guaranteed. Past performance is not a guarantee of future results.
© 2021 Broadridge Financial Solutions, Inc. All Rights Reserved.