Stocks closed last week generally higher, despite a weak jobs report. A Congressional deal to extend the debt ceiling until early December helped drive stocks higher during the middle of the week. A poor showing last Friday was not enough to prevent the benchmark indexes from closing the week mostly in the black. The Dow enjoyed its biggest weekly gain since June. The S&P 500 advanced, while the Global Dow ended the week up over 1.3%. The Nasdaq eked out a gain, but the Russell 2000 dipped nearly 0.4%. Among the market sectors, energy jumped 5.0%, financials rose 2.3%, industrials climbed 1.8%, utilities increased 1.5%, and consumer staples advanced 1.4%. The yield on 10-year Treasuries gained 14 basis points to close the week at the highest level since June 4. Crude oil prices continued to rise, closing in on $80.00 per barrel. The dollar rose marginally, while gold prices declined.
Wall Street did not get off to a strong start last Monday. The Dow fell over 320 points and the Nasdaq lost more than 2.0%. A sell-off in shares of tech/growth stocks including a major social-media company, led equities lower last Monday. With Monday’s downturn, the Nasdaq has declined about 7.0% since its September 7 peak as it inches closer to -10.0% correction territory. A jump in energy and utility shares wasn’t enough to keep the S&P 500 from dipping 1.3%. The Russell 2000 lost 1.1% and the Global Dow slid 0.3%. Treasury yields and crude oil prices rose, while the dollar slipped.
Tech shares recovered from Monday’s decline to help drive the market higher last Tuesday. The Nasdaq jumped 1.3% to lead the benchmark indexes. The S&P 500 gained 1.1%, the Dow climbed 0.9%, the Global Dow gained 0.8%, and the Russell 2000 added 0.5%. The yield on 10-year Treasuries rose to 1.52%. Crude oil prices gained nearly 2.0% to reach $79.14 per barrel. The dollar advanced nearly 0.25%. Financials, communication services, and information technology increased at least 1.5% to lead the market sectors.
Wall Street ended last Wednesday generally higher on news that Congress was making progress toward a debt ceiling resolution. The Nasdaq (0.5%), the S&P 500 (0.4%), and the Dow (0.3%) rose, while the Russell 2000 (-0.6%) and the Global Dow (-0.3%) fell. Ten-year Treasury yields dipped, but remained over 1.52%. The dollar advanced, while crude oil prices declined. Energy, materials, and health care were the only market sectors to fall. Consumer staples and real estate advanced 1.0%.
Stocks posted a third straight day of gains last Thursday following the deal to push back the expiration of the debt ceiling to December 3. A larger-than-expected decline in new claims for unemployment insurance also helped bolster investor confidence. Consumer discretionary, health care, and materials led the market sectors. Each of the benchmark indexes listed here gained ground, led by the Russell 2000 (1.6%), followed by the Nasdaq (1.1%), the Dow (1.0%), the Global Dow (0.9%), and the S&P 500 (0.8%). Treasury yields reached 1.57%. The dollar dipped, while crude oil prices climbed nearly 2.0% to $78.85 per barrel.
Equities fell on weak jobs data last Friday. The Russell 2000 (-0.8%) and the Nasdaq (-0.5%) headed the declines. Only the Global Dow ended the day in the black. Energy and financials were the only market sectors to end the day higher. Ten-year Treasury yields continued to climb, closing last Friday at 1.60%. The dollar fell for the second consecutive day, while crude oil prices rose for the second consecutive day.
The national average retail price for regular gasoline was $3.190 per gallon on October 4, $0.015 per gallon more than the prior week’s price and $1.018 higher than a year ago. Gasoline production decreased during the week ended October 1, averaging 9.4 million barrels per day. U.S. crude oil refinery inputs averaged 15.7 million barrels per day during the week ended October 1 — 330,000 barrels per day more than the previous week’s average. Refineries operated at 89.6% of their operable capacity, up from the prior week’s level of 88.1%.
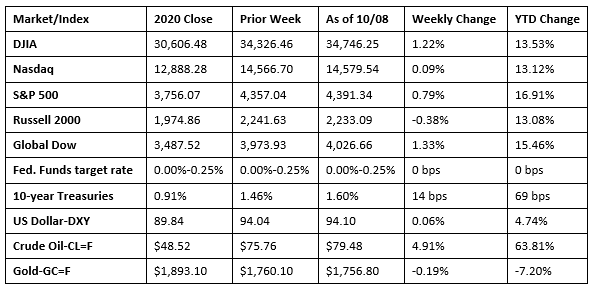
Chart reflects price changes, not total return. Because it does not include dividends or splits, it should not be used to benchmark performance of specific investments.
Last Week’s Economic News
- Employment rose by 194,000 in September, well short of expectations. There were some encouraging signs, however. The unemployment rate fell by 0.4 percentage point to 4.8%, down from 7.8% in September 2020. The number of unemployed persons decreased by 710,000 to 7.7 million (12.5 million in September 2020). Despite these improving figures, they remain above their levels prior to the COVID-19 pandemic (3.5% and 5.7 million, respectively, in February 2020). Employment is down 5.0 million, or 3.3%, from its pre-pandemic level in February 2020. The labor force participation rate dipped 0.1 percentage point to 61.6%, while the employment-population ratio inched up 0.2 percentage point to 58.7%. The number of persons not in the labor force who currently want a job was 6.0 million in September. These individuals were not counted as unemployed because they were not actively looking for work during the last four weeks or were unavailable to take a job. In September, 13.2% of employed persons teleworked because of the pandemic, while 5.0 million persons reported that they had been unable to work because their employer closed or lost business due to the pandemic. Average hourly earnings rose by $0.19 to $30.85 in September. Average hourly earnings have risen 4.6% since September 2020. The average work week increased 0.2 hour to 34.8 hours.
- According to the latest report from IHS Markit, the purchasing managers’ services index expanded in September, but at the slowest pace in the last 13 months. Labor shortages hindered output growth, while sales were negatively impacted by the spread of COVID-19. Meanwhile, cost pressures rose for the second consecutive month as input prices increased at a steep rate. Companies continued to pass on higher costs to clients, but at the slowest pace in the last five months.
- The goods and services trade deficit expanded by 4.2% to $73.3 billion in August. Exports grew 0.5%, while imports increased 1.4%. Year to date, the goods and services deficit increased $140.8 billion, or 33.7%, from the same period in 2020. Exports increased $244.3 billion, or 17.5%. Imports increased $385.1 billion, or 21.2%. The trade deficit for goods (not including services) with China increased $3.1 billion to $28.1 billion in August. The deficit with Canada increased $1.4 billion to $5.1 billion, while the deficit with Mexico decreased $1.9 billion to $6.6 billion.
- The number of new claims for unemployment insurance benefits rose for the third consecutive week. For the week ended October 2, there were 326,000 new claims for unemployment insurance, a decrease of 38,000 from the previous week’s level, which was revised up by 2,000. According to the Department of Labor, the advance rate for insured unemployment claims for the week ended September 25 was 2.0%, a decrease of 0.1 percentage point from the previous week’s rate, which was revised up by 0.1 percentage point. The advance number of those receiving unemployment insurance benefits during the week ended September 25 was 2,714,000, a decrease of 97,000 from the prior week’s level, which was revised up by 9,000. This is the lowest level for insured unemployment since March 14, 2020, when it was 1,770,000. For comparison, last year at this time, there were 782,000 initial claims for unemployment insurance, and the rate for unemployment claims was 7.2%. During the last week of February 2020 (pre-pandemic), there were 219,000 initial claims for unemployment insurance, and the number of those receiving unemployment insurance benefits was 1,724,000. States and territories with the highest insured unemployment rates for the week ended September 18 were Puerto Rico (4.5%), Illinois (4.2%), California (3.1%), Hawaii (3.0%), New Jersey (2.9%), Nevada (2.8%), Alaska (2.7%), Oregon (2.7%), Louisiana (2.5%), and New York (2.5%). States and territories with the largest increases in initial claims for the week ended September 25 were California (+9,907), Michigan (+6,115), Texas (+4,625), the District of Columbia (+2,223), and Minnesota (+2,002), while the largest decreases were in Virginia (-7,245), Maryland (-5,617), Arizona (-4,241), Louisiana (-3,160), and Ohio (-2,853).
Eye on the Week Ahead
The latest reports on inflationary trends are available this week. Transitory or not, inflation has been rising for the past several months. The Consumer Price Index has risen 5.3%, the Producer Price Index is up 8.3%, import prices have increased 9.0%, and export prices have climbed 16.8%.
The Week Ahead

The information provided is obtained from sources believed to be reliable. Forecasts cannot be guaranteed. Past performance is not a guarantee of future results.
© 2021 Broadridge Financial Solutions, Inc. All Rights Reserved.