Despite a shaky start, Wall Street enjoyed a strong week of gains. A favorable start to corporate earnings season helped lift equities higher. Each of the benchmark indexes listed here posted solid weekly gains, led by the Nasdaq and the S&P 500. The dollar and Treasury yields slipped, while crude oil prices rose 3.5% to $82.25 per barrel. Despite the generally positive week, investors will continue to keep an eye on economic data and rising prices. Higher oil, gas, and other commodity prices could raise concerns about inflationary pressures and how they could drag down corporate profit margins. Materials shortages, rising wages, and shipping bottlenecks have driven up costs for producers. Many have passed these costs on to consumers, leading to more persistent inflation. Initial earnings data comes from banks and financial institutions. The next few weeks will see earnings reports from the bulk of companies in most sectors and may reveal the impact that inflation and supply demands has had on earnings margins so far in the third quarter.
Monday was the Columbus Day and Indigenous Peoples’ Day public holidays but stock markets were open and bond markets were closed. The Dow and the S&P 500 fell 0.7%, while the Nasdaq and the Russell 2000 dipped 0.6% on what was a fairly slow trading day. Crude oil prices rose 1.5% to reach $80.51 per barrel, a multi-year high. Investors may be waiting for the next round of corporate earnings data to weigh the potential impact of rising energy prices, labor costs, and supply-chain bottlenecks.
Stocks fell again last Tuesday. Only the small caps of the Russell 2000 ended the day in the black, gaining 0.6%. The Global Dow (-0.4%), the Dow (-0.3%), the S&P 500 (-0.2%), and the Nasdaq (-0.1%) declined. Ten-year Treasury yields dipped below 1.6%, closing the day at 1.58%. Crude oil prices were little changed, while the dollar advanced 0.2%. Consumer discretionary, real estate, and utilities led the market sectors, while communication services, information technology, and health care declined by at least 0.5%.
Equities rose for the first time in four sessions last Wednesday. With inflationary pressures continuing to run hot (see Consumer Price Index information below), technology shares increased, as investors seemed to focus on companies better able to pass on higher costs to consumers. The Nasdaq led the surge, climbing 0.7%, followed by the Russell 2000 and the S&P 500, which climbed 0.3%. The Dow and the Global Dow broke even on the day. Treasury yields, crude oil prices, and the dollar declined. Among the market sectors, utilities (1.1%) and information technology (0.6%) advanced, while financials dipped 0.6%.
Stocks rallied last Thursday, buoyed by strong bank earnings reports and encouraging unemployment data. Each of the benchmark indexes listed here gained at least 1.0%, led by the Nasdaq and the S&P 500, which added 1.7%. The Dow gained 1.6%, the Russell 2000 climbed 1.4%, and the Global Dow advanced 1.1%. The dollar and Treasury yields eased for the second consecutive day, while crude oil prices rose to $81.53 per barrel. Materials and information technology gained 2.4% and 2.3%, respectively, to lead the market sectors.
The market advanced for the third consecutive day last Friday. Strong earnings data and stronger-than-expected retail sales provided encouragement for investors. The Dow advanced 1.1%, followed by the Global Dow (0.9%), the S&P 500 (0.8%), and the Nasdaq (0.5%). The small caps of the Russell 2000 slipped 0.4%. Ten-year Treasury yields climbed 3.8%, crude oil prices rose 1.2%, while the dollar was little changed. The market sectors closed Friday generally higher, with consumer discretionary (1.8%) and financials (1.5%) leading the pack.
The national average retail price for regular gasoline was $3.267 per gallon on October 11, $0.077 per gallon more than the prior week’s price and $1.100 higher than a year ago. Gasoline production increased during the week ended October 8, averaging 9.6 million barrels per day. U.S. crude oil refinery inputs averaged 15.1 million barrels per day during the week ended October 8 — 700,000 barrels per day less than the previous week’s average. Refineries operated at 86.7% of their operable capacity, down from the prior week’s level of 89.6%.
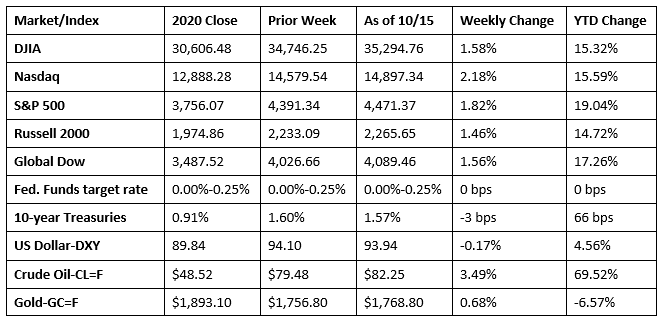
Chart reflects price changes, not total return. Because it does not include dividends or splits, it should not be used to benchmark performance of specific investments.
Last Week’s Economic News
- Consumer prices continued to escalate in September. According to the latest report from the Bureau of Labor Statistics, the Consumer Price Index increased 0.4% last month after advancing 0.3% in August. Over the last 12 months ended in September, consumer prices have risen 5.4%. The price index less food and energy rose 0.2% in September and 4.0% over the last 12 months. In September, several price indexes increased, including the index for food (0.9%), food at home (1.2%), energy (1.3%), fuel oil (3.9%), new vehicles (1.3%), and shelter (0.4%). Price indexes that decreased include apparel (-1.1%), used cars and trucks (-0.7%), and transportation services (-0.5%). Since September 2020, the price index for energy has risen 24.8%, with gasoline prices advancing 42.1% and fuel oil prices up 42.6%.
- Producer prices advanced 0.5% in September after climbing 0.7% the previous month. Producer prices have risen 8.6% over the past 12 months ended in September, the largest 12-month increase in the history of the index, which began November 2010. A 1.3% increase in goods accounted for nearly 80% of the overall price increase. Driving goods prices higher was a 2.8% jump in prices for energy (gasoline prices rose 3.9%). Producer prices for services moved up 0.2% in September, led by a 0.9% increase in trade services (a measure of the margins received by wholesalers and retailers).
- Retail sales increased 0.7% in September following a 0.9% jump in August. Retail sales have risen 13.9% since September 2020. Excluding motor vehicle and gasoline sales, retail sales advanced 0.7%, an indication that total consumer spending was strong in September.
- Import prices climbed 0.4% in September after declining 0.3% the prior month. The September rise in imports was the largest one-month increase since a 1.1% advance in June. In September, the advance was led by higher fuel import prices (3.7%). Since September 2020, import prices have risen 9.2%. Export prices ticked up 0.1% following a 0.4% increase in August. Export prices haven’t declined since April 2020 and are up 16.3% over the past 12 months.
- The number of job openings decreased by 659,000 in August to 10.4 million. The rate of job openings also declined 0.4 percentage point to 6.6%. In August, there were 6.8 million hires, a decrease of 439,000 from July’s total. The number of separations in August, at 6.0 million, rose by 209,000. Within separations, the number of quits increased in August to 4.3 million (+242,000), and the quits rate increased to a series high of 2.9%. Over the 12 months ended in August, hires totaled 72.6 million and separations totaled 66.7 million, yielding a net employment gain of 5.9 million.
- For the week ended October 9, there were 293,000 new claims for unemployment insurance, a decrease of 36,000 from the previous week’s level, which was revised up by 3,000. This is the lowest level for initial claims since March 14, 2020, when it was 256,000. According to the Department of Labor, the advance rate for insured unemployment claims for the week ended October 2 was 1.9%, a decrease of 0.1 percentage point from the previous week’s rate. The advance number of those receiving unemployment insurance benefits during the week ended October 2 was 2,593,000, a decrease of 134,000 from the prior week’s level, which was revised up by 13,000. This is the lowest level for insured unemployment since March 14, 2020, when it was 1,770,000. For comparison, last year at this time, there were 833,000 initial claims for unemployment insurance, and the rate for unemployment claims was 6.3%. During the last week of February 2020 (pre-pandemic), there were 219,000 initial claims for unemployment insurance, and the number of those receiving unemployment insurance benefits was 1,724,000. States and territories with the highest insured unemployment rates for the week ended September 25 were Illinois (4.4%), Puerto Rico (4.3%), California (3.3%), Hawaii (2.9%), the Virgin Islands (2.8%), New Jersey (2.7%), the District of Columbia (2.6%), Nevada (2.6%), Alaska (2.5%), and Pennsylvania (2.5%). The largest increase in initial claims for the week ended October 2 was in Pennsylvania (+1,707), while the largest decreases were in California (-14,733), the District of Columbia (-3,905), Michigan (-3,370), Missouri (-2,598), and Texas (-2,376).
Eye on the Week Ahead
The Federal Reserve’s report on industrial production for September is available this week. The industrial sector has been advancing, despite supply-chain bottlenecks and labor shortages, which have led to increased costs. Data from the housing sector is also out this week, with reports on housing starts and existing home sales. Housing starts rose nearly 4.0% in August, although sales of existing homes fell more than 2.0%.
The Week Ahead

The information provided is obtained from sources believed to be reliable. Forecasts cannot be guaranteed. Past performance is not a guarantee of future results.
© 2021 Broadridge Financial Solutions, Inc. All Rights Reserved.