Historically, 10% stock market pullbacks are annual occurrences. Aside from some interesting intraday fireworks due to automated trading and the implosion of various derivatives created to track market volatility, the last several weeks have not been unusual. The financial media, whose main incentive is to generate revenue from advertising dollars, wants readers and viewers to stay tuned and keep clicking. They know this won’t happen if they report there is nothing new here and nothing significant is happening. Although short-term price movement is generally random, reporters insist each price movement is extremely important and we must search the explanations for each hour’s price change in order to keep us coming back. It can be an addiction for some. Think back to the market’s last double digit correction which ended on February 11, 2016, down 13.3%, and try to remember the reasons analysts gave for that pullback. Even if you can recall a few, they have not made any difference in your retirement and estate plan. They had no lasting impact on the economy. This pullback is likely to be no different.
On The One Hand
- The ISM Non-Manufacturing Index came in at 59.9 for January. The reading was above expectation, higher than the 56.0 posted in December and the highest level since August 2005.
- Outstanding consumer credit rose by $18.4 billion in December following November’s increase of $31.0 billion. Credit increased 5.4% in 2017 after growing 6.7% in 2016.
- Initial unemployment claims were 221,000, a decline of 9,000 from the previous week. The four-week moving average declined to 234,500, the lowest level for this average since March 10, 1973 when it was 222,000. Continuing claims decreased by 33,000 to 1.923 million.
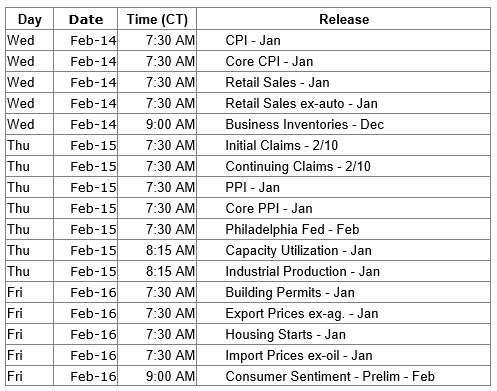
- Wholesale inventories rose 0.4% in December. Wholesale sales outpaced the inventory increase by rising 1.2% in December on top of an upwardly revised 1.9% increase in November. We are looking forward to this week’s total business inventories and sales figures.
On The Other Hand
The December U.S. trade deficit at $53.1 billion was the largest since late 2008. The report is likely to add to the argument for trade restrictions.
All Else Being Equal
The pace of growth in the service sector is beginning to pick up. In the past year, U.S. imports rose 9.5% and exports grew 7.3%. The expansion of trade was a positive for the global economy. These and the rest of the firming economic developments will help keep Q1 GDP growth estimates at or above 3%. All of this will keep moderate pressure on interest rates.
Last Week’s Market

The Week Ahead

The information provided is obtained from sources believed to be reliable. Forecasts cannot be guaranteed. Past performance is not a guarantee of future results.