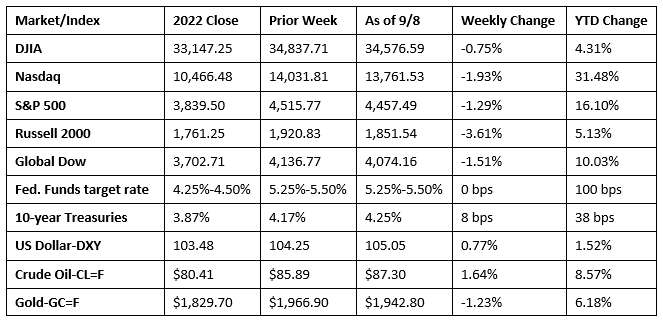
Wall Street saw stocks slide lower last week, with each of the benchmark indexes closing in the red. Trading was choppy throughout the holiday-shortened week as traders anticipated this week’s inflation data. The Russell 2000 fell the furthest, followed by the Nasdaq, the S&P 500, the Global Dow, and the Dow. Crude oil prices advanced for the second straight week and are on track for a second consecutive monthly gain as some OPEC+ including Russian extended supply cuts. As investors await this week’s Consumer Price Index, rising oil prices could push overall prices higher than expected. Last week, 10-year Treasury yields rose as did the dollar, while gold prices declined.
Stocks opened last Tuesday in the red, with each of the benchmark indexes losing value. The Russell 2000 fell 2.1%, followed by the Global Dow (-0.8%), the Dow (-0.6%), the S&P 500 (-0.4%), and the Nasdaq (-0.1%). Crude oil prices reached $86.71 per barrel, a 2023 high, after Saudi Arabia and Russia said they would extend production cuts for the remainder of the year. Ten-year Treasury yields climbed 9.5 basis points to reach 4.26%. The dollar jumped 0.7%, while gold prices slid 0.8%. Ten-year Treasury yields ticked up 2.2 basis points to 4.29%. The dollar was flat. Gold prices slid 0.5%.
Wall Street saw stocks slide again last Wednesday on fears of rising inflation. Crude oil prices continued to rise, climbing to $87.55 per barrel. Interest rate-sensitive tech shares lagged, with information technology falling 1.4%. The Nasdaq fell the furthest among the benchmark indexes listed here after losing 1.1%. The S&P 500 dropped 0.7%, followed by the Dow (-0.6%), the Global Dow (-0.4%), and the Russell 2000 (-0.3%).
Last Thursday, the Nasdaq posted its fourth straight session loss, while the S&P 500 fell for the third consecutive day. Tech shares pulled the benchmark indexes lower as China reported its intent to broaden its ban on Apple iPhones. The Dow inched up 0.2% on the day, the only index of those listed here to post a gain. The Russell 2000 (-1.0%) and the Global Dow (-0.4%) declined, along with the Nasdaq (-0.9%) and the S&P 500 (-0.3%). The yield on 10-year Treasuries slipped 3.0 basis points to 4.26%. Crude oil prices reversed an upward trend, falling 0.8% to settle at $86.86 per barrel. Both the dollar and gold prices declined.
Stocks closed mostly higher last Friday. The Dow added 0.2%, while the Nasdaq and the S&P 500 each inched up 0.1%. The Global Dow and the Russell 2000 dipped 0.2% and 0.1%, respectively. Ten-year Treasury yields were flat. Thursday’s decline in crude oil prices proved short-lived as prices per barrel rose 0.5% on Friday. The dollar and gold prices were unchanged.

Chart reflects price changes, not total return. Because it does not include dividends or splits, it should not be used to benchmark performance of specific investments.
Last Week’s Economic News
- The international trade in goods and services deficit was $65.0 billion in July, up $1.3 billion, or 2.0% from the previous month. July exports were $251.7 billion, $3.9 billion, or 1.6%, more than June exports. July imports were $316.7 billion, $5.2 billion, or 1.7%, more than June imports. Year to date, the goods and services deficit decreased $128.3 billion, or 21.4%, from the same period in 2022. Exports increased $27.3 billion, or 1.6%. Imports decreased $101.0 billion, or 4.3%.
- Growth in the services sector slowed in August, according to the latest purchasing managers’ index from S&P Global. Business activity increased at the slowest pace in the past seven months, as a contraction in new business orders weakened output. The drop in client demand was attributed to interest rate increases and elevated inflation. As a result of the decrease in new business, new hirings by service firms were at the slowest pace in nearly a year.
- The national average retail price for regular gasoline was $3.807 per gallon on September 4, $0.006 per gallon lower than the prior week’s price but $0.061 more than a year ago. Also, as of September 4, the East Coast price decreased $0.023 to $3.655 per gallon; the Midwest price fell $0.007 to $3.630 per gallon; the Gulf Coast price dropped $0.014 to $3.364 per gallon; the Rocky Mountain price increased $0.024 to $3.999 per gallon; and the West Coast price advanced $0.032 to $4.912 per gallon.
- For the week ended September 2, there were 216,000 new claims for unemployment insurance, a decrease of 13,000 from the previous week’s level, which was revised up by 1,000. According to the Department of Labor, the advance rate for insured unemployment claims for the week ended August 26 was 1.1%, a decrease of 0.1 percentage point from the previous week’s rate. The advance number of those receiving unemployment insurance benefits during the week ended August 26 was 1,679,000, a decrease of 40,000 from the previous week’s level, which was revised down by 6,000. States and territories with the highest insured unemployment rates for the week ended August 19 were New Jersey (2.6%), California (2.2%), Puerto Rico (2.1%), Rhode Island (2.1%), Hawaii (2.0%), Massachusetts (2.0%), New York (1.9%), Connecticut (1.8%), Oregon (1.8%), and Pennsylvania (1.8%). The largest increases in initial claims for unemployment insurance for the week ended August 26 were in New York (+3,581), Oregon (+890), Michigan (+722), Virginia (+466), and Oklahoma (+284), while the largest decreases were in Ohio (-4,632), Missouri (-1,583), Hawaii (-1,413), Texas (-666), and Connecticut (-464).
Eye on the Week Ahead
The latest reports on the Consumer Price Index and the Producer Price Index are out this week. Consumer prices edged up 0.2% in July and 3.2% for the 12 months ended in July. Producer prices rose 0.3% in July and 0.8% for the year.
The Week Ahead

The information provided is obtained from sources believed to be reliable. Forecasts cannot be guaranteed. Past performance is not a guarantee of future results.
© 2021 Broadridge Financial Solutions, Inc. All Rights Reserved.