U.S. stocks outpaced the rest of the world last week as global investors sought relief from the turmoil caused by European elections. Tech stocks carried the market as investors digested a pair of cooling inflation reports. The Nasdaq closed at record highs every day last week, and the S&P 500 also posted a solid gain, while the Russell 2000, the Dow, and the Global Dow all lost ground. The benchmark 10-year Treasury yield saw its largest weekly decline of the year. Crude oil prices surged, gold prices rose, and the dollar advanced for the fourth week in a row.
Stocks edged higher to begin last week. Big tech firms, particularly AI companies, helped support the market uptick. Bond yields rose, with 10-year Treasuries closing at 4.46% after gaining nearly 4.0 basis points. The Nasdaq led the benchmark indexes listed here after gaining 0.4%. The S&P 500 and the Russell 2000 added 0.3%. The Dow rose 0.2%, while the Global Dow dipped 0.2%. Crude oil prices closed at about $77.95 per barrel, up $2.42. The dollar and gold prices advanced. Utilities and energy led the market sectors, while financials and materials underperformed.
On Tuesday, the Nasdaq (0.9%) and the S&P 500 (0.3%) notched fresh records following the announcement by a major tech company of its AI platform. The remaining benchmark indexes closed in the red, led by the Global Dow (-0.8%), followed by the Russell 2000 (-0.4%) and the Dow (-0.3%). Bond prices jumped higher, pulling yields down, with 10-year Treasury yields falling 6.5 basis points to 4.40%. Crude oil prices moved up marginally to $77.86 per barrel. The dollar edged up 0.1% against a basket of currencies, while gold prices gained 0.2%.
Stocks surged again on Wednesday when the latest inflation data came in cooler than expected, and ended the day higher even though the Fed later dialed back its interest rate forecasts for the remainder of 2024 (see below). Most of the benchmark indexes listed here posted gains led by the Russell 2000 and the Nasdaq, which climbed 1.8% and 1.5%, respectively. The S&P 500 added about 0.9%, followed by the Global Dow (0.4%). The Dow edged down 0.1%. Ten-year Treasury yields fell 11 basis points, landing slightly below 4.3%, in response to the news on inflation and interest rates. Crude oil prices rose again, closing at $78.47 per barrel. The dollar fell 0.5%, while gold prices rose 0.6%.
Stock market performance was mixed last Thursday, after a gauge of wholesale prices unexpectedly reported the largest decline in seven months. Only the Nasdaq (0.3%) and the S&P 500 (0.2%) held on to small gains, while the small caps of the Russell 2000 (-0.9%), the Global Dow (-0.7%), and the Dow (-0.2%) all lost value. Information technology and real estate gained the most among the market sectors, while communication services and energy fell the furthest. Ten-year Treasury yields ticked down to 4.24%. Gold fell 1.5% and crude oil prices declined 0.5%, while the dollar advanced 0.5%.
On Friday, global equity markets reacted to growing anxiety over a political crisis in France, and a closely-watched gauge of U.S. consumer sentiment dove to a seven-month low. Four of the benchmark indexes closed the session lower, led by the Russell 2000, which fell 1.6%. The Global Dow declined 0.6%, while the S&P 500 and the Dow dipped 0.4% and 0.2%, respectively. The Nasdaq edged up 0.1%. Gold prices jumped 1.2% and the dollar rose, while 10-year Treasury yields dipped to 4.21%. Crude oil prices ticked up slightly.
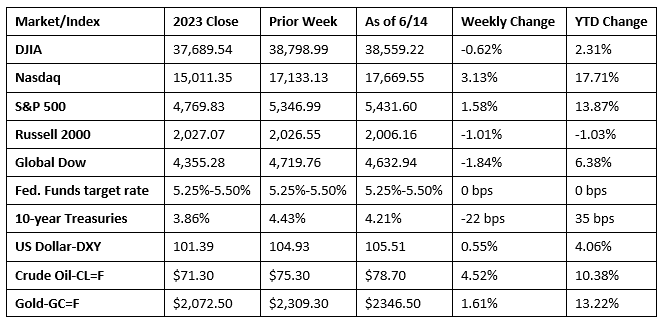
Chart reflects price changes, not total return. Because it does not include dividends or splits, it should not be used to benchmark performance of specific investments.
Last Week’s Economic News
- The Federal Reserve announced that the target range for the federal funds rate would remain at 5.25%-5.50%, a decision that was widely expected. Based on projections for interest rates by the end of next year, it now appears that Fed officials anticipate making just one rate cut of 0.25% later this year, followed by four more cuts in 2025.
- The Consumer Price Index was unchanged in May, after increasing 0.3% in April. The index less food and energy rose 0.2% in May, after rising 0.3% in April. Prices for shelter continued to climb in May, more than offsetting a decline in gasoline prices. Prices for energy fell 2.0%, while prices for food rose 0.1%. The CPI advanced 3.3% for the 12 months ended in May, a slower pace than the 3.4% advance for the 12 months ended in April. Energy prices increased 3.7% for the 12 months ended in May, while food prices increased 2.1% over the last year. Prices less food and energy (core CPI) rose 3.4% for the year ended in May, down from 3.6% in April, and the smallest 12-month increase since 2021. Prices for motor vehicle insurance increased 20.3% over the last year, and a 5.4% rise in shelter prices accounted for over two thirds of the 12-month increase in core CPI.
- The Producer Price Index, which measures prices producers receive for goods and services, decreased 0.2% in May after increasing 0.5% in April. This was the largest drop in wholesale prices since October. For the year ended in May, the PPI rose 2.2%, edging down from a 2.3% rise in April. Producer prices less foods, energy, and trade services were unchanged in May, following a 0.5% increase in April. For the 12 months ended in May, prices less foods, energy, and trade services rose 3.2%.
- Prices for U.S. imports decreased 0.4% in May following a 0.9% increase the previous month. This was the first 1-month decline since December 2023. Lower fuel and nonfuel prices contributed to the overall decline. Prices for imports rose 1.1% for the year ended in May. Export prices fell 0.6% in May after rising 0.6% in April. Lower prices for nonagricultural exports in May more than offset higher agricultural prices. The price index for exports rose 0.6% over the past 12 months.
- The federal deficit for May was $347.1 billion, well above the May 2023 deficit of $240.3 billion. In May, government receipts were $323.6 billion and expenditures totaled $670.8 billion. Through the first eight months of fiscal year 2024, the government deficit sits at $1.2 trillion, significantly lower than the $1.7 trillion deficit over the same period of the previous fiscal year.
- The national average retail price for regular gasoline was $3.429 per gallon on June 10, $0.087 per gallon below the prior week’s price and $0.166 per gallon less than a year ago. Also, as of June 10, the East Coast price fell $0.073 to $3.370 per gallon; the Midwest price decreased $0.087 to $3.262 per gallon; the Gulf Coast price declined $0.094 to $2.951 per gallon; the Rocky Mountain price decreased $0.097 to $3.263 per gallon; and the West Coast price declined $0.116 to $4.371 per gallon.
- For the week ended June 8, there were 242,000 new claims for unemployment insurance, an increase of 13,000 from the previous week’s unrevised level. According to the Department of Labor, the advance rate for insured unemployment claims for the week ended June 1 was 1.2%, unchanged from the previous week’s rate. The advance number of those receiving unemployment insurance benefits during the week ended June 1 was 1,820,000, an increase of 30,000 from the previous week’s unrevised level. States and territories with the highest insured unemployment rates for the week ended May 25 were New Jersey (2.3%), California (2.1%), Washington (1.7%), Massachusetts (1.6%), Rhode Island (1.6%), Illinois (1.5%), New York (1.5%), Alaska (1.4%), Connecticut (1.4%), Nevada (1.4%), Pennsylvania (1.4%), and Puerto Rico (1.4%). The largest increases in initial claims for unemployment insurance for the week ended June 1 were in Minnesota (+2,788), California (+1,974), Ohio (+1,692), Pennsylvania (+1,566), and Florida (+784), while the largest decreases were in Michigan (-2,706), Texas (-1,822), Tennessee (-1,295), New York (-1,016), and Georgia (-809).
Eye on the Week Ahead
Several areas of the economy are highlighted this week, starting with the May retail sales report. Inflationary pressures at the retail level were somewhat muted in April. The Federal Reserve report on industrial production for May is also coming out. Industrial production was unchanged in April, although manufacturing output slowed. Lastly, the Census Bureau report on housing starts for May and data on existing home sales will be released. The number of issued building permits declined in April, while housing starts advanced. Sales of existing homes declined in April, although the median price for existing homes rose to over $400,000.
The Week Ahead

The information provided is obtained from sources believed to be reliable. Forecasts cannot be guaranteed. Past performance is not a guarantee of future results.
© 2021 Broadridge Financial Solutions, Inc. All Rights Reserved.