The stock market fared quite nicely during the Fourth of July week. Each of the benchmark indexes listed here posted gains, with the Nasdaq and the S&P 500 reaching record highs a few times during the week. Only the small caps of the Russell 2000 slid lower. The June jobs report (see below) gave investors encouragement that the Fed may be inclined to cut interest rates as early as September. Information technology, consumer discretionary, and communication services outperformed among the market sectors, while energy and health care lagged. Ten-year Treasury yields dipped 7.0 basis points. Crude oil prices advanced as tensions in the Middle East escalated. Gas prices increased, while some expect prices at the pump to continue to rise.
Wall Street opened the Fourth of July week with a bang. The Nasdaq gained 0.8% largely due to a strong performance from megacaps. The S&P 500 and the Global Dow rose 0.3%, while the Dow ticked up 0.1%. The small caps of the Russell 2000 fell 0.9% following its annual reconstitution, when breakpoints between large, mid, and small caps are redefined to make certain that market changes from the preceding year are reflected accurately. This annual event often leads to one of the highest-volume trading days as investors adjust their holdings based on the updates. Ten-year Treasury yields spiked higher, climbing 13.6 basis points to close at 4.47%. Crude oil prices also advanced, settling at about $83.46 per barrel after gaining $1.92. The dollar and gold prices changed marginally.
Stocks climbed higher last Tuesday as investors took encouragement from Fed Chair Jerome Powell’s comments, which indicated that significant progress has been made in bringing down inflation. However, Powell said modest economic expansion, coupled with a healthy labor market, has allowed the Fed to be patient in deciding about the next steps in its monetary policy. By the close of trading, the Nasdaq (0.8%) and the S&P 500 (0.6%) notched new record highs. The Dow rose 0.4%, the Global Dow advanced 0.3%, and the Russell 2000 gained 0.2%. Yields on 10-year Treasuries fell 4.3 basis points to settle at 4.43%. Crude oil prices ticked down to $83.03 per barrel. The dollar declined 0.2%, while gold prices were flat.
The Dow (-0.1%) was the only benchmark index listed here to close in the red last Wednesday. The Nasdaq (0.9%) and the S&P 500 (0.5%) reached record highs for the second straight day. The Global Dow (0.6%) and the small caps of the Russell 2000 (0.1%) also closed higher. Ten-year Treasury yields settled at 4.35%. Crude oil prices rose to $83.88 per barrel. The dollar edged lower, while gold prices rose 1.5%.
Stocks closed out the holiday-shortened week with mixed results. The Nasdaq (0.9%) and the S&P 500 (0.5%) closed the day at record highs, while the Dow advanced 0.2%. The Russell 2000 (-0.4%) and the Global Dow (-0.1%) closed the day lower. Ten-year Treasury yields fell 8.3 basis points, settling at 4.27%. Crude oil prices declined $0.63 to about $83.25 per barrel. The dollar fell for the fourth straight session, while gold prices advanced 1.2%.
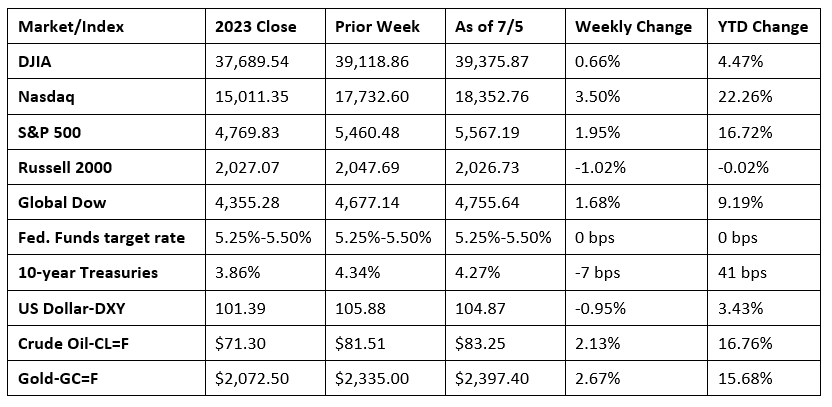
Chart reflects price changes, not total return. Because it does not include dividends or splits, it should not be used to benchmark performance of specific investments.
Last Week’s Economic News
- Total employment rose by 206,000 in June, slightly under the average monthly gain of 220,000 over the prior 12 months. Last month, job gains occurred in government, health care, social assistance, and construction. Total employment proved not to be quite as robust as originally thought. The change in total employment for April was revised down by 57,000, and the change for May was revised down by 54,000. With these revisions, employment in April and May combined was 111,000 lower than previously reported. In June, the unemployment rate was 4.1%, an increase of 0.1 percentage point from the May rate. The number of unemployed rose by 162,000 in June to 6.8 million. These measures are higher than a year earlier when the jobless rate was 3.6%, and the number of unemployed was 6.0 million. The number of long-term unemployed (those jobless for 27 weeks or more) rose by 166,000 to 1.5 million in June. This measure is up from 1.1 million a year earlier. The long-term unemployed accounted for 22.2% of all unemployed people in June. The labor force participation rate rose 0.1 percentage point to 62.6%. The employment-population ratio was unchanged in June at 60.1%. In June, average hourly earnings increased by $0.10, or 0.3%, to $35.00. Over the past 12 months, average hourly earnings have increased by 3.9%. The average workweek in June was 34.3 hours for the third consecutive month.
- The S&P Global US Manufacturing Purchasing Managers’ Index™ ticked up to a three-month high of 51.6 in June. New orders rose for the second straight month, prompting a rise in production. Survey respondents noted that employment increased at the fastest rate since September 2022. While producer costs continued to rise, the rate of input cost inflation eased in June, and selling prices rose at the slowest pace this year.
- Business activity and new orders expanded in June, according to the S&P Global US Services PMI®. Activity in the services sector has risen in each of the past 17 months, with the latest expansion the most pronounced since April 2022. Survey respondents noted that the rising demand sparked an increase in workforce numbers for the first time in three months. Both input and output prices eased in June.
- According to the latest Job Openings and Labor Turnover Summary, the number of job openings in May rose by 221,000 (8.1 million), the number of hires increased by 141,000 (5.8 million), and the number of total separations grew by 85,000 (5.4 million).
- The goods and services trade deficit for May was $75.1 billion, up $0.6 billion from the April deficit, according to the latest report from the Bureau of Economic Analysis. May exports were $261.7 billion, $1.8 billion less than April exports. May imports were $336.7 billion, $1.2 billion less than April imports. Year to date, the goods and services deficit increased $14.4 billion, or 4.2%, from the same period in 2023. Exports increased $42.8 billion, or 3.4%. Imports increased $57.2 billion, or 3.6%.
- The national average retail price for regular gasoline was $3.479 per gallon on July 1, $0.041 per gallon above the prior week’s price but $0.048 per gallon less than a year ago. Also, as of July 1, the East Coast price rose $0.026 to $3.389 per gallon; the Midwest price increased $0.092 to $3.415 per gallon; the Gulf Coast price advanced $0.055 to $3.071 per gallon; the Rocky Mountain price increased $0.055 to $3.351 per gallon; and the West Coast price fell $0.032 to $4.236 per gallon.
- For the week ended June 29, there were 238,000 new claims for unemployment insurance, an increase of 4,000 from the previous week’s level, which was revised up by 1,000. According to the Department of Labor, the advance rate for insured unemployment claims for the week ended June 22 was 1.2%, unchanged from the previous week’s rate. The advance number of those receiving unemployment insurance benefits during the week ended June 22 was 1,858,000, an increase of 26,000 from the previous week’s level, which was revised down by 7,000. This is the highest level for insured unemployment since November 27, 2021, when it was 1,878,000. States and territories with the highest insured unemployment rates for the week ended June 15 were New Jersey (2.2%), California (2.1%), Minnesota (2.0%), Puerto Rico (1.9%), Pennsylvania (1.7%), Rhode Island (1.7%), Washington (1.7%), Illinois (1.6%), Nevada (1.6%), Massachusetts (1.5%), and New York (1.5%). The largest increases in initial claims for unemployment insurance for the week ended June 22 were in New Jersey (+5,371), Massachusetts (+3,785), Connecticut (+1,243), Oregon (+968), and Rhode Island (+810), while the largest decreases were in Minnesota (-2,993), Texas (-2,495), Pennsylvania (-2,454), Illinois (-2,117), and California (-1,226).
Eye on the Week Ahead
Important inflation data is on tap for this week. The Consumer Price Index for June is out. May showed no increase in the CPI and a slight reduction in the 12-month figure. Also available this week is the Producer Price Index for June. May saw producer prices fall 0.2%.
The Week Ahead

The information provided is obtained from sources believed to be reliable. Forecasts cannot be guaranteed. Past performance is not a guarantee of future results.
© 2021 Broadridge Financial Solutions, Inc. All Rights Reserved.