Investors were encouraged by the most recent inflation data, raising expectations of an interest rate cut in September. Each of the benchmark indexes listed here closed the week in the black, led by the Russell 2000. The small-cap index recorded its best weekly performance since October 2023, while reaching its highest level since January 2022. The expectation of falling interest rates and economic strengthening likely prompted the market shift to more interest-sensitive small- and mid-cap stocks. The Dow rose above 40,000 at one point on Friday, ultimately closing at 40,000. The S&P 500 climbed above 5,600. Crude oil prices slipped lower. While prices at the pump may have risen nationally last week, as of July 1, weekly U.S. average gasoline prices actually declined $0.19 per gallon since the 2024 high on April 22, falling to $3.48/gallon on July 1, $0.05 per gallon less than the price a year ago. Increasing gasoline inventories, relatively weak demand, and oil prices below recent peaks contributed to falling gasoline prices.
Wall Street began the week with mixed results last Monday. The Nasdaq (0.3%) and the S&P 500 (0.1%) reached new record highs. The small caps of the Russell 2000 led the benchmark indexes listed here, climbing 0.6%. The Dow and the Global Dow dipped 0.1%. Ten-year Treasury yields inched lower to 4.26%. Crude oil prices fell $0.90 to $82.26 per barrel. The dollar edged up 0.1%, while gold prices fell 1.3%. Not surprisingly, the market sectors were also mixed last Monday. Information technology outperformed, while communication services fell over 1.0%.
Stocks were mixed last Tuesday. While the Nasdaq and the S&P 500 ticked up a mere 0.1%, it was enough to reach new record highs for both indexes. The Russell 2000, which had enjoyed a solid session the previous day, was unable to maintain that momentum after falling 0.5%. The Global Dow lost 0.3%, while the Dow dipped 0.1%. Fed Chair Jerome Powell spoke before the Senate last Tuesday and noted that more favorable data showing signs of cooling inflation could prompt the Fed to lower interest rates. Yields on 10-year Treasuries edged up to 4.30%. Crude oil prices fell for the second straight day, settling at about $81.59 per barrel. The dollar and gold prices moved higher.
The Nasdaq (1.2%) and the S&P 500 (1.0%) stretched their respective streaks of record highs to five straight sessions last Wednesday. This was the 37th record close for the S&P 500 in 2024 as it climbed above 5,600 for the first time in its history. The Dow and the Russell 2000 gained 1.1%, while the Global Dow advanced 0.6%. Big tech and AI stocks helped drive the market surge, while investors took encouragement from Fed Chair Jerome Powell’s comments to the House Financial Services Committee. Ten-year Treasury yields fell to 4.28%. Crude oil prices reversed a period of declines, rising to $82.38 per barrel. The dollar slid 0.1%, while gold prices rose 0.4%.
The market was mixed last Thursday. The Russell 2000 gained 3.6%, the Global Dow rose 0.5%, and the Dow inched up 0.1%. The streak of record highs ended for the Nasdaq (-2.0%) and the S&P 500 (-0.9%). Megacap tech shares declined the furthest in over a year as investors, believing the Fed may cut interest rates as early as September, began to reshuffle their holding. Bond values increased, pulling yields lower, with the 10-year Treasury note falling to 4.19%. Crude oil prices jumped $0.74 to $82.84 per barrel. The dollar fell 0.6%, while gold prices rose 1.7%.
Stocks ended the week on a high note, with each of the benchmark indexes listed here posting gains last Friday. The Russell 2000 enjoyed another notable day of gains after climbing 1.1%. The Nasdaq, the S&P 500, and the Dow added 0.6%. The Global Dow gained 0.5%. Ten-year Treasury yields ticked lower for the third straight session, ending the day and the week at 4.18%. Crude oil prices fell $0.34 per barrel last Friday. The dollar and gold prices also closed the day lower.
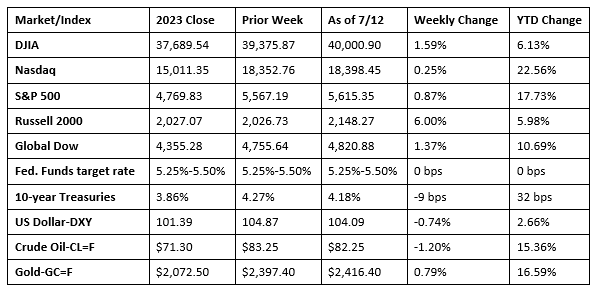
Chart reflects price changes, not total return. Because it does not include dividends or splits, it should not be used to benchmark performance of specific investments.
Last Week’s Economic News
- In what is most likely good news for investors looking for the Fed to lower interest rates, the June Consumer Price Index declined 0.1%. This is the first time since May 2020 that the CPI registered less than 0% for a month. Prices rose 3.0% over the last 12 months, a smaller increase than the 3.3% advance for the 12 months ended May. A 0.2% increase in prices for shelter was offset by a 2.0% drop in energy prices, within which gasoline prices declined 3.8%. Prices for shelter, which accounts for about one-third of the CPI basket of goods and services, have displayed a slowdown in price increases over the past few months. For the 12 months ended in June, prices for shelter rose 5.2%, down from 5.4% for the 12 months ended in May. Food prices rose 0.2% in June. Consumer prices less food and energy rose 0.1% in June after rising 0.2% the preceding month. Prices less food and energy rose 3.3% over the last 12 months, which was the smallest 12-month increase since April 2021.
- Prices at the producer level advanced 0.2% in June after being unchanged in the previous month. Producer prices rose 2.6% for the 12 months ended in June, the largest advance since March 2023. The June rise in producer prices could be traced to a 0.6% increase in prices for services. In contrast, prices for goods decreased 0.5%. Nearly all the June increase in prices for services was attributable to a 1.9% jump in margins for trade services (the difference between wholesale and retail prices). Prices less foods, energy, and trade services were unchanged in June following a 0.2% advance in May. For the 12 months ended in June, prices less foods, energy, and trade services moved up 3.1%.
- The Treasury budget deficit for June was $66.0 billion, well below the May deficit of $348.0 billion. For the current fiscal year, the total deficit is $1,268.3 trillion. The deficit over the same period in the last fiscal year was $1,393.0 trillion.
- The national average retail price for regular gasoline was $3.489 per gallon on July 8, $0.010 per gallon above the prior week’s price but $0.057 per gallon less than a year ago. Also, as of July 8, the East Coast price rose $0.061 to $3.450 per gallon; the Midwest price decreased $0.048 to $3.367 per gallon; the Gulf Coast price fell $0.013 to $3.058 per gallon; the Rocky Mountain price increased $0.080 to $3.431 per gallon; and the West Coast price declined $0.010 to $4.226 per gallon.
- For the week ended July 6, there were 222,000 new claims for unemployment insurance, a decrease of 17,000 from the previous week’s level, which was revised up by 1,000. According to the Department of Labor, the advance rate for insured unemployment claims for the week ended June 29 was 1.2%, unchanged from the previous week’s rate. The advance number of those receiving unemployment insurance benefits during the week ended June 29 was 1,852,000, a decrease of 4,000 from the previous week’s level, which was revised down by 2,000. States and territories with the highest insured unemployment rates for the week ended June 22 were New Jersey (2.4%), California (2.2%), Minnesota (2.1%), Puerto Rico (2.1%), Rhode Island (2.0%), Connecticut (1.8%), Pennsylvania (1.8%), Illinois (1.7%), Massachusetts (1.7%), and Washington (1.7%). The largest increases in initial claims for unemployment insurance for the week ended June 29 were in New York (+4,427), New Jersey (+2,557), Georgia (+1,849), California (+1,478), and Iowa (+1,270), while the largest decreases were in Connecticut (-1,831), Wisconsin (-875), Minnesota (-731), Maryland (-690), and Vermont (-534).
Eye on the Week Ahead
The retail sales report for June is available this week. Sales of goods and services to consumers ticked up 0.1% in May and 2.3% over the past 12 months. Another important report to consider this week is the Federal Reserve’s index of industrial production for June. Industrial production and manufacturing rose 0.9% in May. Overall, industrial production is up 0.4% from May 2023, while manufacturing is up 0.1%.
The Week Ahead

The information provided is obtained from sources believed to be reliable. Forecasts cannot be guaranteed. Past performance is not a guarantee of future results.
© 2021 Broadridge Financial Solutions, Inc. All Rights Reserved.