The market saw stocks come in with mixed returns. The Dow and the Russell 2000 advanced, while the Nasdaq, the S&P 500, and the Global Dow lost value. The Dow reached three new records during the week, while the Nasdaq and the S&P 500 posted their worst week since April. AI stocks led a downturn in tech shares as investors moved to small caps. The CrowdStrike outage impacted flights, banks, telecoms, and media companies worldwide. The market sectors ran the gambit of highs and lows, with energy (1.7%), financials (1.3%), and real estate (1.3%) climbing, while information technology (-4.6%) and communication services (-2.8%) declined. Ten-year Treasury yields rose 5.0 basis points. Crude oil prices declined on demand worries centered on China. The dollar inched up, while gold prices dipped lower.
Wall Street began last week on a high note, with each of the benchmark indexes listed here closing higher. The Dow reached a record high after climbing 0.5%. The Nasdaq gained 0.4%, the S&P 500 added 0.3%, while the big gainer was the Russell 2000, which advanced 1.8%. The Global Dow ticked down 0.2%. Ten-year Treasury yields rose 4.0 basis points to reach 4.81%. Crude oil prices fell $0.31 to settle at $81.90 per barrel. The dollar and gold prices rose 0.1% and 0.2%, respectively.
Stocks pushed higher for the second straight day last Tuesday. The small caps of the Russell 2000 gained 3.5%, followed by the Dow, which added 1.9% to record a new record. The S&P 500 rose 0.6%, the Global Dow advanced 0.5%, and the Nasdaq ticked up 0.2%. Industrial stocks made notable gains, while several companies reported better-than-expected second-quarter earnings. Yields on 10-year Treasuries slid to 4.16%. Crude oil prices fell again, closing at about $80.87 per barrel on weaker economic data from China. The dollar was unchanged, while gold prices rose 1.8%.
Last Wednesday saw the Dow (0.6%) continue its record streak, and the Global Dow ticked up 0.2%. The remaining benchmark indexes listed here declined, with the Nasdaq falling 2.8%, marking the worst day for that index since 2022. The S&P 500 dropped 1.4%, and the Russell 2000 lost 1.1%. Ten-year Treasury yields slid to 4.14%. Crude oil prices reversed a run of losses after gaining $2.14 to settle at $82.90 per barrel. The dollar fell 0.5%, and gold prices lost 0.3%.
Wednesday’s tech rout continued last Thursday. The small caps of the Russell 2000 lost 1.9%, while the Dow, which had a run of record highs, fell 1.3%. The S&P 500 lost 0.8%, while the Nasdaq and the Global Dow declined 0.7%. Investors took profits from tech shares in response to the potential negative impact export restrictions to China may have on the semiconductor market. Yields on 10-year Treasuries climbed to 4.18%. Crude oil prices slid to $82.29 per barrel. the dollar gained 0.42%, while gold prices fell 0.7%.
Last Friday saw stocks close mostly lower, likely impacted by the CrowdStrike IT outage, which caused major disruptions worldwide. The Global Dow fell 1.0%, while the Dow fell 0.9%. The Nasdaq (-0.8%) and the S&P 500 (-0.7%) lost value for the third straight day. The Russell 2000 dropped 0.6%. Ten-year Treasury yields added 5.0 basis points to close at 4.23%. Crude oil prices dipped $2.56 to settle at $80.26 per barrel. The dollar inched up 0.2%, while gold prices fell 2.3%.
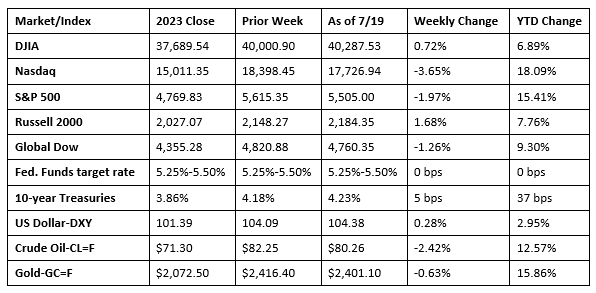
Chart reflects price changes, not total return. Because it does not include dividends or splits, it should not be used to benchmark performance of specific investments.
Last Week’s Economic News
- Retail sales in June were virtually unchanged from the previous month but were up 2.3% from a year earlier. Retail sales less motor vehicle and parts and gasoline stations rose 0.8% in June. Retail trade sales dipped 0.1% in June but rose 2.0% from June 2023. Nonstore retail sales rose 1.9% in June and 8.9% over the last 12 months.
- Import prices were unchanged in June after falling 0.2% in May. Lower import fuel prices in June offset higher nonfuel prices. Import fuel prices decreased 1.0% in June. Import prices advanced 1.6% for the year ended in June, the largest 12-month increase since December 2022. Export prices decreased 0.5% last month following a 0.7% drop in May. The May and June declines were the first one-month decreases since December 2023. Export prices advanced 0.7% over the past 12 months.
- The number of residential building permits issued in June rose 3.4% from the May rate but were 3.1% below the June 2023 estimate. Building permits for single-family homes declined 2.3% last month. Housing starts increased 3.0% in June, while falling 4.4% over the last 12 months. Single-family housing starts slid 2.2% below the May figure. Housing completions in June were 10.1% above the May estimate and 15.5% over the June 2023 rate. Single-family housing completions in June were 1.8% above the prior month’s estimate.
- Industrial production rose 0.6% in June after advancing 0.9% in May. For the second quarter, industrial production increased 4.3%. Manufacturing output advanced 0.4% last month and 1.1% for the year. In June, mining rose 0.3%, and utilities increased 2.8%. Since June 2023, mining dipped 0.6%, while utilities advanced 7.9%. Total industrial production in June was 1.6% above its year-earlier level.
- The national average retail price for regular gasoline was $3.496 per gallon on July 15, $0.007 per gallon above the prior week’s price but $0.063 per gallon less than a year ago. Also, as of July 15, the East Coast price rose $0.016 to $3.466 per gallon; the Midwest price increased $0.002 to $3.369 per gallon; the Gulf Coast price advanced $0.052 to $3.110 per gallon; the Rocky Mountain price decreased $0.045 to $3.486 per gallon; and the West Coast price declined $0.035 to $4.191 per gallon.
- For the week ended July 13, there were 243,000 new claims for unemployment insurance, an increase of 20,000 from the previous week’s level, which was revised up by 1,000. According to the Department of Labor, the advance rate for insured unemployment claims for the week ended July 6 was 1.2%, unchanged from the previous week’s rate. The advance number of those receiving unemployment insurance benefits during the week ended July 6 was 1,867,000, an increase of 20,000 from the previous week’s level, which was revised down by 5,000. This is the highest level for insured unemployment since November 27, 2021, when it was 1,878,000. States and territories with the highest insured unemployment rates for the week ended June 29 were New Jersey (2.6%), Rhode Island (2.2%), California (2.1%), Minnesota (2.0%), Puerto Rico (2.0%), Pennsylvania (1.8%), Connecticut (1.7%), Massachusetts (1.7%), Washington (1.7%), Illinois (1.6%), Nevada (1.6%), and New York (1.6%). The largest increases in initial claims for unemployment insurance for the week ended July 6 were in Michigan (+10,578), New York (+5,247), Indiana (+2,835), Ohio (+1,604), and Tennessee (+1,166), while the largest decreases were in California (-5,672), New Jersey (-5,517), Georgia (-1,900), Texas (-1,809), and Minnesota (-1,078).
Eye on the Week Ahead
There’s plenty of market-moving economic data out this week. June reports on sales of both new and existing homes are available. May saw sales of new homes rise, while existing home sales declined. The initial report for second quarter gross domestic product follows a 1.4% advance in the first quarter. The report on personal income and expenditures is also available this week. The personal consumption expenditures price index, a measure of inflation preferred by the Federal Reserve, was flat in May.
The Week Ahead

The information provided is obtained from sources believed to be reliable. Forecasts cannot be guaranteed. Past performance is not a guarantee of future results.
© 2021 Broadridge Financial Solutions, Inc. All Rights Reserved.