Stocks were mixed last week, with the Dow and the Russell 2000 adding value, while the Nasdaq, the S&P 500, and the Global Dow ended the week in the red. Tech shares took a hit as investors prepared for this week’s earnings data from four megacap giants. For the week, communication services, information technology, and energy closed lower among the market sectors. Health care and utilities posted the largest gains. The June personal consumption expenditures (PCE) price index, the Fed’s preferred measure of inflation, was somewhat encouraging (see below). While the data is not favorable enough for the Fed to lower interest rates next week, it is trending in the right direction to lead to a possible interest rate cut in September. Crude oil prices declined on rising expectations of a cease-fire in Gaza and growing concerns on waning demand in China.
Tech shares rebounded from last week’s sell-off last Monday as traders assessed the political landscape after President Joe Biden ended his bid for re-election. The small caps of the Russell 2000 (1.7%) and the Nasdaq (1.6%) led the benchmark indexes listed here, while the S&P 500 advanced 1.1%. The Global Dow climbed 0.5%, and the Dow added 0.3%. Yields on 10-year Treasuries ticked up 2.1 basis points to 4.26%. Crude oil prices dipped to $79.95 per barrel. The dollar and gold prices moved marginally.
Last Tuesday saw stocks edge lower as investors awaited earnings data from major tech companies. Of the benchmark indexes listed here, only the Russell 2000 added value after gaining 1.0%. The remaining indexes dipped 0.2% or less. Ten-year Treasury yields slid to 4.23%. Crude oil prices continued to fall, dropping $1.13 to close at $77.27 per barrel. The dollar inched up 0.1%, while gold prices rose 0.6%.
Stocks fell last Wednesday after underwhelming megacap earnings led to a tech sell-off. The Nasdaq (-3.6%) suffered its worst single trading day since October 2022, while the S&P 500 (-2.3%) had its worst day since December 2022. The Russell 2000 fell 2.1%, the Dow dropped 1.3%, and the Global Dow lost 0.9%. Ten-year Treasury yields rose 4.7 basis points to 4.28%. Crude oil prices ended several days of declines, rising to $77.54 per barrel. The dollar dipped 0.1%, and gold prices fell 0.3%.
The Nasdaq (-0.9%) continued its tailspin last Thursday, while the small caps of the Russell 2000 gained 1.3%. The Dow ended the session up 0.2%. The Global Dow (-0.7%) and the S&P 500 (-0.5%) declined. Bond prices rose, pulling yields lower, with the 10-year note falling 3.0 basis points to 4.25%. Crude oil prices increased for the second straight day, settling at $78.12 per barrel. The dollar was flat, while gold prices slid 2.3%.
Stocks enjoyed a solid day last Friday, with each of the benchmark indexes posting gains. The Russell 2000 advanced 1.7%, followed by the Dow (1.6%), the S&P 500 (1.1%), the Nasdaq (1.0%), and the Global Dow (0.9%). Ten-year Treasury yields slipped to 4.20%. Crude oil prices fell to $76.81 per barrel. The dollar was flat, while gold prices rose 1.4%.
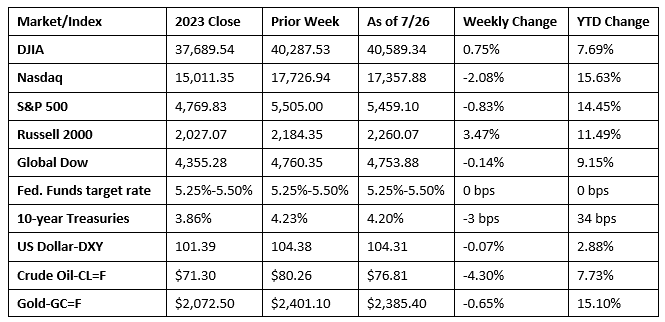
Chart reflects price changes, not total return. Because it does not include dividends or splits, it should not be used to benchmark performance of specific investments.
Last Week’s Economic News
- According to the first, or advanced, estimate gross domestic product increased 2.8% in the second quarter. GDP rose 1.4% in the first quarter. The increase in GDP primarily reflected increases in consumer spending (2.3%), private inventory investment (8.4%), and nonresidential fixed investment (5.2%). Imports (6.9%), which are a subtraction in the calculation of GDP, increased. The personal consumption expenditures (PCE) price index, a measure of inflation, increased 2.6%, compared with an increase of 3.4% in the first quarter. Excluding food and energy prices, the PCE price index increased 2.9%, compared with an increase of 3.7% in the previous quarter.
- The PCE price index inched up 0.1% in June and 2.5% over the last 12 months. In May, the PCE price index was unchanged, and the 12-month rate was 2.6%. Excluding food and energy, the PCE price index rose 0.2% in June and 2.6% for the year. Last month, both personal income and disposable (after-tax) personal income rose 0.2%. Personal consumption expenditures, a measure of consumer spending, advanced 0.3% in June.
- New orders for manufactured durable goods decreased 6.6% in June following four consecutive monthly increases. Excluding transportation, new orders increased 0.5%. Excluding defense, new orders decreased 7.0%. Transportation equipment, down two of the last three months, drove the overall decrease, falling 20.5%. New orders for nondefense capital goods fell 22.4% last month, while new orders for defense capital goods increased 6.1%.
- The international trade in goods deficit decreased 2.5% in June. Exports of goods in June rose 2.5%. Imports of goods in June inched up 0.7%.
- Existing-home sales slumped in June, falling 5.4% below the May rate and 5.4% below the estimate from a year earlier. According to the National Association of Realtors®, homes are sitting on the market a bit longer, and sellers are receiving fewer offers. Total housing inventory was at a 4.1-month supply in June, up from 3.7 months in May. The last time unsold inventory posted a four-month supply was May 2020. The median existing-home sales price in June, at $426,900, reached a new record high, rising from $417,200 in May and well above the June 2023 price of $410,100. According to Freddie Mac, the 30-year fixed-rate mortgage averaged 6.77% as of July 18. That’s down from 6.89% one week ago and 6.78% one year ago. Sales of existing single-family homes declined 5.1% from a month earlier and dropped 4.3% from June 2023.
- Sales of new single-family homes fell 0.6% in June from a month earlier and were 7.4% below the June 2023 estimate. The median sales price of new houses sold in June 2024 was $417,300. The average sales price was $487,200. Inventory represented a supply of 9.3 months at the current sales rate. The median existing single-family home price in June was $432,700, up from May’s estimate of $422,400 and above the June 2023 price of $415,700.
- The national average retail price for regular gasoline was $3.471 per gallon on July 22, $0.025 per gallon under the prior week’s price, and $0.125 per gallon less than a year ago. Also, as of July 22, the East Coast price fell $0.057 to $3.409 per gallon; the Midwest price increased $0.057 to $3.426 per gallon; the Gulf Coast price decreased $0.063 to $3.047 per gallon; the Rocky Mountain price declined $0.063 to $3.323 per gallon; and the West Coast price decreased $0.054 to $4.137 per gallon.
- For the week ended July 20, there were 235,000 new claims for unemployment insurance, a decrease of 10,000 from the previous week’s level, which was revised up by 2,000. According to the Department of Labor, the advance rate for insured unemployment claims for the week ended July 13 was 1.2%, unchanged from the previous week’s rate. The advance number of those receiving unemployment insurance benefits during the week ended July 13 was 1,851,000, a decrease of 9,000 from the previous week’s level, which was revised down by 7,000. States and territories with the highest insured unemployment rates for the week ended July 6 were New Jersey (2.8%), Rhode Island (2.7%), Puerto Rico (2.4%), California (2.3%), Minnesota (2.2%), Massachusetts (1.9%), Pennsylvania (1.9%), Connecticut (1.8%), Washington (1.8%), Illinois (1.7%), Nevada (1.7%), and New York (1.7%). The largest increases in initial claims for unemployment insurance for the week ended July 13 were in Texas (+11,927), California (+6,284), Georgia (+3,101), Missouri (+2,999), and South Carolina (+2,413), while the largest decreases were in New Jersey (-1,532), Massachusetts (-1,531), Indiana (-1,407), Tennessee (-937), and Iowa (-853).
Eye on the Week Ahead
The Federal Open Market Committee meets this week, and while it is highly unlikely that the Fed will adjust interest rates at this time, the Committee might provide a more concrete indication as to when rates may be lowered. The employment data for July is also out this week. The labor sector has been steady during the period as the Fed tries to harness inflation.
The Week Ahead

The information provided is obtained from sources believed to be reliable. Forecasts cannot be guaranteed. Past performance is not a guarantee of future results.
© 2021 Broadridge Financial Solutions, Inc. All Rights Reserved.