Market volatility continued last week as stocks tumbled Monday and Wednesday, only to rebound at the end of last week, but not enough to avoid closing in the red for the second week in a row. Each of the benchmark indexes listed here lost value, with the small caps of the Russell 2000 falling the furthest. Despite the recent downturn, the indexes remain ahead year to date. Among the market sectors, only industrials and communication services closed higher, while materials and utilities shed the most value. Crude oil prices ended a losing streak, gaining nearly 4.0% last week. The dollar was flat, while gold prices slipped lower. Bond prices fluctuated throughout the week, ultimately settling lower, which drove yields higher.
The stock sell-off continued last Monday on increasing worries over a U.S. economic slowdown. Markets worldwide took a hit as investors feared that weak economic data and mediocre corporate earnings could be signs of a recession. The S&P 500 (-3.0%) and the Dow (-2.6%) had their worst day in over two years. The Nasdaq (-3.4%) endured its worst start to a month since 2008. The Global Dow (-3.4%) and the Russell 2000 (-3.3%) also slid lower. Ten-year Treasury yields headed to their lowest levels in a year after settling at 3.78%. Crude oil prices closed at $72.94 per barrel. The dollar slid 0.4%, while gold prices fell 0.8%.
The markets moved higher last Tuesday as investors took advantage of equities that had fallen in value. The Russell 2000 led the benchmark indexes, gaining 1.2%, followed by the Global Dow (1.1%), the Nasdaq (1.0%), and the Dow (0.8%). Bond prices fell, driving yields higher, with 10-year Treasuries gaining 10.3 basis points to close at 3.88%. Crude oil prices settled at $73.09 per barrel. The dollar edged higher, while gold prices fell 0.6%.
Tuesday’s market rebound proved to be short-lived as stocks trended lower by the close of trading last Wednesday. The Russell 2000 lost about 1.4% and the Nasdaq fell 1.1%. The S&P 500 declined 0.8% and the Dow dipped 0.6%. The Global Dow rose 0.5%. Ten-year Treasury yields marched toward 4.00%, ending the session just short at 3.96%. Crude oil prices advanced nearly 3.0% to $75.37 per barrel. The dollar gained 0.2%, while gold prices fell 0.2%.
In what turned into a roller coaster of a week, stocks jumped higher last Thursday, led by a 2.9% increase by the Nasdaq. The Russell 2000 advanced 2.4%, the S&P 500 gained 2.3%, the Dow rose 1.8%, and the Global Dow increased 1.0%. Weekly jobless claims unexpectedly fell 17,000 (see below), which brightened the mood of investors. Yields on 10-year Treasuries settled at 3.99% after gaining 0.3 basis points. Crude oil prices rose 1.1% to $76.04 per barrel. The dollar was unchanged. Gold prices gained 1.3%.
Large caps and tech shares rose higher, while small caps lagged to close out last week. There was no economic data released last Friday, so investors could focus on inflation data set to be released this week. The Global Dow led the indexes, gaining 0.6%, followed by the Nasdaq and the S&P 500, which both advanced 0.5%. The Dow inched up 0.1%, while the Russell 2000 fell 0.2%. The market sectors mostly advanced, with only industrials and materials falling lower. Ten-year Treasury yields fell to 3.94% as bond prices climbed higher. Crude oil prices advanced 1.0% to $76.97 per barrel. Gold prices edged up 0.3%, while the dollar inched lower.
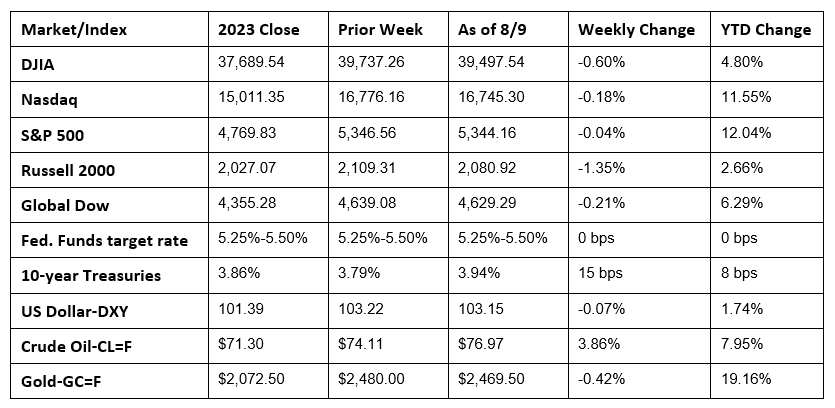
Chart reflects price changes, not total return. Because it does not include dividends or splits, it should not be used to benchmark performance of specific investments.
Last Week’s Economic News
- While the manufacturing sector may have slowed in July, the services sector saw an expansion of business activity last month. A rise in new orders has encouraged companies to take on extra staff. Input cost inflation accelerated, but the increased costs were passed on to consumers. The S&P Global US Services PMI® business Activity Index posted a reading of 55.0, signaling monthly expansion in services activity, which has continued for 18 months.
- The goods and services trade deficit was $73.1 billion in June (the most recent data available), down $1.9 billion, or 2.5%, from the previous month. Exports, at $265.9 billion, increased by 1.5%, while imports, at $339.0 billion, advanced 0.6%. The June decrease in the goods and services deficit reflected a decrease in the goods deficit of $2.5 billion to $97.4 billion and a decrease in the services surplus of $0.6 billion to $24.2 billion. Year to date, the goods and services deficit increased $22.7 billion, or 5.6%, from the same period in 2023. Exports increased $58.0 billion, or 3.8%. Imports increased $80.7 billion, or 4.2%.
- The national average retail price for regular gasoline was $3.448 per gallon on August 5, $0.036 per gallon under the prior week’s price and $0.380 per gallon less than a year ago. Also, as of August 5, the East Coast price fell $0.020 to $3.375 per gallon; the Midwest price decreased $0.048 to $3.428 per gallon; the Gulf Coast price dipped $0.084 to $3.010 per gallon; the Rocky Mountain price advanced $0.040 to $3.435 per gallon; and the West Coast price decreased $0.026 to $4.080 per gallon.
- For the week ended August 3, there were 233,000 new claims for unemployment insurance, a decrease of 17,000 from the previous week’s level, which was revised up by 1,000. According to the Department of Labor, the advance rate for insured unemployment claims for the week ended July 27 was 1.2%, unchanged from the previous week’s rate. The advance number of those receiving unemployment insurance benefits during the week ended July 27 was 1,875,000, an increase of 6,000 from the previous week’s level, which was revised down by 8,000. This is the highest level for insured unemployment since November 27, 2021, when it was 1,878,000. States and territories with the highest insured unemployment rates for the week ended July 20 were New Jersey (2.8%), Rhode Island (2.6%), Puerto Rico (2.4%), California (2.3%), Minnesota (2.0%), Pennsylvania (1.9%), Connecticut (1.8%), Illinois (1.7%), Massachusetts (1.7%), New York (1.7%), and Washington (1.7%). The largest increases in initial claims for unemployment insurance for the week ended July 27 were in Michigan (+4,027), Missouri (+3,410), Massachusetts (+2,127), Virginia (+637), and Minnesota (+487), while the largest decreases were in Texas (-6,607), New York (-2,396), Ohio (-2,377), Florida (-1,587), and Tennessee (-1,488).
Eye on the Week Ahead
Inflation data for July is released this week. The Consumer Price Index dipped 0.1% in June, and investors will be looking for similar results in July. Prices producers paid, on the other hand, rose 0.2% in June.
The Week Ahead

The information provided is obtained from sources believed to be reliable. Forecasts cannot be guaranteed. Past performance is not a guarantee of future results.
© 2021 Broadridge Financial Solutions, Inc. All Rights Reserved.