Wall Street rebounded after a rough start to the month, to close out its best week of the year. Investors saw a lot of economic data that did little to change the expectations of an interest rate reduction in September. Last week’s gains ended four straight weeks of losses, fueled by concerns that the Federal Reserve hadn’t lowered interest rates soon enough to prevent a major economic slowdown. However, favorable inflation data, robust retail sales, and fewer unemployment claims reassured investors’ confidence, leading to a market rally. Each of the benchmark indexes listed here closed the week higher. All 11 of the S&P 500 market sectors gained ground, with information technology climbing more than 8.0%. Ten-year Treasury yields dipped lower as bond values advanced. Crude oil prices inched lower. The dollar declined, while gold prices increased.
Last Monday stocks closed generally lower as investors awaited upcoming inflation data later in the week. The Nasdaq edged up 0.2% and the S&P 500 closed flat. The remaining benchmark indexes listed here closed in the red, led by the Russell 2000, which lost 0.9%, followed by the Dow (-0.4%) and the Global Dow (-0.1%). Information technology, energy, and utilities posted gains, while real estate and communication services fell the furthest. Ten-year Treasury yields opened the week at 3.90%. Crude oil prices rose 3.6% to settle at $79.62 per barrel. The dollar was muted, while gold prices rose 1.6%.
Wall Street closed higher last Tuesday as investors assessed a lower-than-expected Producer Price Index (see below). Tech shares led the market uptick, helping to drive the Nasdaq (2.4%) higher. The remaining benchmarks listed here also posted solid gains. The S&P 500 rose 1.7%, followed by the Russell 2000 (1.6%), the Global Dow (1.3%), and the Dow (1.0%). Ten-year Treasury yields dipped 5.7 basis points to 3.85%. Crude oil prices ended a mini rally, falling to $78.49 per barrel. The dollar fell 0.5%, while gold prices ticked up 0.1%.
Investors were encouraged by the latest Consumer Price Index (see below), which matched expectations for July, but unexpectedly declined to 2.9% for the 12 months ended in July, the lowest 12-month rate since March 2021. The favorable inflation data helped push stocks generally higher last Wednesday. The Global Dow and the Dow led the benchmarks, each gaining 0.6%, followed by the S&P 500, which climbed 0.4%. The Nasdaq eked out a minimal gain of less than 0.1%, while the Russell 2000 fell 0.5%. Crude oil prices continued to trend lower, ending the session at $77.09 per barrel after OPEC+ cut its 2024 demand forecast. Yields on 10-year Treasuries fell to 3.82%. The dollar edged up 0.1%, while gold prices fell 0.9%.
Last Thursday saw the release of another round of favorable economic data. Retail sales advanced (see below), while unemployment claims declined, bolstering investor confidence in the economy. Each of the benchmark indexes listed here posted solid gains, led by the Russell 2000, which advanced 2.5%. The Nasdaq rose 2.3%, followed by the S&P 500 (1.6%), the Dow (1.4%), and the Global Dow (0.9%). Bond prices fell as stock values rose. Ten-year Treasury yields climbed over 10.0 basis points, settling at 3.92%. Crude oil prices rose 1.3% to $77.96 per barrel. The dollar gained 0.4% and gold prices rose 0.5%.
Stocks pushed higher last Friday, with each index listed here posting gains. The Global Dow advanced 1.0% and the Russell 2000 rose 0.3%, while the Dow, the S&P 500, and the Nasdaq each gained about 0.2%. Ten-year Treasury yields slipped to 3.89%. The dollar and crude oil prices declined 0.5% and 1.8%, respectively. Gold prices rose 2.2%.
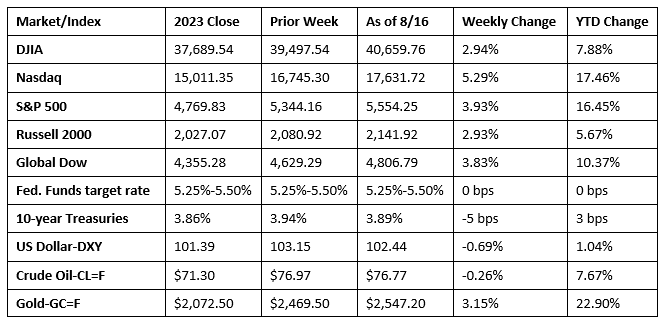
Chart reflects price changes, not total return. Because it does not include dividends or splits, it should not be used to benchmark performance of specific investments.
Last Week’s Economic News
- The Consumer Price Index rose 0.2% in July, in line with expectations. The CPI rose 2.9% for the year ended in July, down 0.1 percentage point from the 12 months ended in June. Nearly 90.0% of the July increase was attributable to a 0.4% advance in shelter prices. Energy prices were unchanged, while food prices increased 0.2%. Prices less food and energy also increased 0.2% in July and 3.2% over the last 12 months.
- Producer prices edged up 0.1% in July after increasing 0.2% in June. Over the last 12 months, producer prices rose 2.2%, which is the lowest 12-month increase since May. Producer prices excluding foods, energy, and trade services increased 0.2% in July and 3.3% for the year ended in July. The increase in producer prices last month is largely attributable to a 0.6% increase in prices for goods, the largest increase since February. Prices for services decreased 0.2%, which marked the first monthly decline since December 2023.
- Retail sales rose 1.0% in July after declining 0.2% in June. Retail sales advanced 2.7% for the 12 months ended in July. Retail trade sales were up 1.1% last month and 2.6% from last year. Sales, excluding motor vehicles and parts, rose 0.4% in July. Sales at motor vehicle and parts dealers climbed 3.6% in July. Nonstore (on line) sales ticked up 0.2% last month, while food services and drinking places sales edged up 0.3%.
- Prices for imports ticked up 0.1% in July, after being unchanged the previous month. Prices for imports rose 1.6% for the year ended in July, the largest 12 month increase since the index advanced 3.2% for the 12 months ended in December 2022. Export prices increased 0.7% in July following a 0.3% decline in June. Higher nonagricultural prices in July more than offset lower prices for agricultural exports. The prices index for exports increased 1.4% over the past year, the largest 12-month advance since prices rose 2.0% for the 12 months ended in January 2023.
- Industrial production fell 0.6% in July after increasing 0.3% in June. Early July shutdowns in petrochemical and related industries due to Hurricane Beryl held down the growth of industrial production by an estimated 0.3 percentage point. Manufacturing output stepped down 0.3% as the index for motor vehicles and parts fell nearly 8.0%. Manufacturing excluding motor vehicles and parts rose 0.3%. The index for mining was unchanged, while the index for utilities decreased 3.7%. Total industrial production in July was 0.2% below its year-earlier level.
- The Treasury budget deficit for July was $243.7 billion, well above the June deficit of 71.0 billion. July receipts were $236.0 billion, while total outlays wee $574.1 billion. For the current fiscal year, the total deficit is $1,517.0 trillion. The deficit over the same period in the last fiscal year was $1,613.8 trillion.
- In July, the number of issued building permits for residential construction decreased 4.0% from the June estimate, and 7.0% below the July 2023 rate. The number of building permits for single-family houses dipped 0.1% in July. Housing starts declined 6.8% in July and 16.0% below the rate from a year earlier. Single-family housing starts in July were 14.1% under the June figure. Housing completions decreased 9.8% in July, but were 13.8% above the July 2023 rate. Single-family housing completions in July were 0.5% above the June estimate.
- The national average retail price for regular gasoline was $3.414 per gallon on August 12, $0.034 per gallon under the prior week’s price and $0.436 per gallon less than a year ago. Also, as of August 12, the East Coast price fell $0.049 to $3.326 per gallon; the Midwest price decreased $0.034 to $3.394 per gallon; the Gulf Coast price dipped $0.011 to $2.999 per gallon; the Rocky Mountain price declined $0.021 to $3.414 per gallon; and the West Coast price decreased $0.008 to $4.072 per gallon.
- For the week ended August 10, there were 227,000 new claims for unemployment insurance, a decrease of 7,000 from the previous week’s level, which was revised up by 1,000. According to the Department of Labor, the advance rate for insured unemployment claims for the week ended August 3 was 1.2%, unchanged from the previous week’s rate. The advance number of those receiving unemployment insurance benefits during the week ended August 3 was 1,864,000, a decrease of 7,000 from the previous week’s level, which was revised down by 4,000. States and territories with the highest insured unemployment rates for the week ended July 27 were New Jersey (2.8%), Rhode Island (2.6%), Puerto Rico (2.5%), California (2.3%), Minnesota (2.0%), Connecticut (1.9%), Pennsylvania (1.9%), Massachusetts (1.8%), Illinois (1.7%), Nevada (1.7%), New York (1.7%), and Washington (1.7%). The largest increases in initial claims for unemployment insurance for the week ended August 3 were in New Jersey (+1,080), California (+694), Wisconsin (+672), New York (+607), and Illinois (+579), while the largest decreases were in Michigan (-7,430), Texas (-5,180), Missouri (-3,716), Virginia (-745), and Georgia (-493).
Eye on the Week Ahead
The real estate sector dominates the economic data released this week. Sales of both existing and new homes will look to rebound from a period of declining sales.
The Week Ahead

The information provided is obtained from sources believed to be reliable. Forecasts cannot be guaranteed. Past performance is not a guarantee of future results.
© 2021 Broadridge Financial Solutions, Inc. All Rights Reserved.