Investors finally heard what they had been waiting for after Federal Reserve Chair Jerome Powell gave clear indications that the central bank will lower interest rates in September. Powell noted that the labor market has cooled and inflation is slowing. In an up and down week for stocks, each of the benchmark indexes listed here ended up closing higher, led by the RUSSELL 2000. Crude oil prices rallied at the end of the week, but not enough to avoid closing in the red. Typically, falling interest rates stimulate economic growth, which includes rising demand for oil. However, worldwide energy demand, particularly in China, has waned, keeping oil prices somewhat muted. Ten of the 11 market sectors closed higher, led by materials, consumer discretionary, and financials. Energy ticked lower.
Last Monday saw stocks continue to build off of the prior week’s gains. The S&P 500 (1.4%) and the NASDAQ (1.0%) moved higher for the eighth straight session, the longest streak of the year. The small caps of the RUSSELL 2000 gained 1.2%, the GLOBAL DOW advanced 1.0%, and the DOW added 0.6%. The dollar fell 0.6% to a seven-month low, as signs of waning inflation furthered expectations of an interest rate cut next month. Ten-year Treasury yields dipped to 3.86%. Crude oil prices fell nearly 3.0% to $74.52 per barrel on weak Chinese demand. Gold prices rose 0.2%.
The winning streak for the S&P 500 and the NASDAQ ended at eight days following last Tuesday’s downturn. The RUSSELL 2000 declined 1.2%, the Nasdaq fell 0.3%, the S&P 500 dipped 0.2%, the Dow and the Global Dow slipped 0.1%. Investors pulled back from stocks ahead of the upcoming Jackson Hole symposium, highlighted by a speech from Fed Chair Jerome Powell. Among the market sectors, health care and consumer staples performed the best, while energy and materials were among the worst performers. Yields on 10-year Treasuries continued to decline, settling at 3.81%. Crude oil prices dropped to $73.82 per barrel. The dollar fell 0.5% against a basket of currencies. Gold prices rose 0.5%.
Stocks rallied modestly last Wednesday as minutes from the July Federal Reserve meeting indicated that policymakers would consider easing the restrictive economic policy in place (i.e., lower interest rates) in September. The RUSSELL 2000 recouped most of the prior day’s losses after gaining 1.3%. The NASDAQ rose 0.6%, while the S&P 500 and the GLOBAL DOW gained 0.4%. The DOW inched up 0.1%. Crude oil prices closed in the red, settling at $71.94 per barrel. Ten-year Treasury yields dipped to 3.77%. The dollar declined 0.3%, while gold prices were relatively unchanged.
Volatile continued to best describe the stock market last week. After moving higher last Monday, equities declined on Tuesday, rebounded on Wednesday, and fell on Thursday. Investors awaited Fed Chair Jerome Powell’s Jackson Hole speech with apprehension. While the minutes from the July meeting seemed to support an interest rate decrease, investors may be looking for a more definitive indication from Powell. A drop in tech shares pulled the NASDAQ down 1.7%. The RUSSELL 2000 fell 1.0%, the S&P 500 lost 0.9%, the DOW declined 0.4%, and the GLOBAL DOW dipped 0.3%. Ten-year Treasury yields rose to 3.86%. Crude oil prices climbed 1.4% to $72.94 per barrel. The dollar gained 0.5%, while gold prices edged lower.
On Friday, stocks posted solid gains following Fed Chair Powell’s speech. The RUSSELL 2000 gained 3.2% and the NASDAQ rose 1.5%. The S&P 500 and the GLOBAL DOW added 1.2%, while the DOW advanced 1.1%. Ten-year Treasury yields closed at 3.80%, as they approached their lowest level in 14 months. Crude oil prices rose 2.6%, the dollar fell 0.8%, and gold prices rose 1.2%.
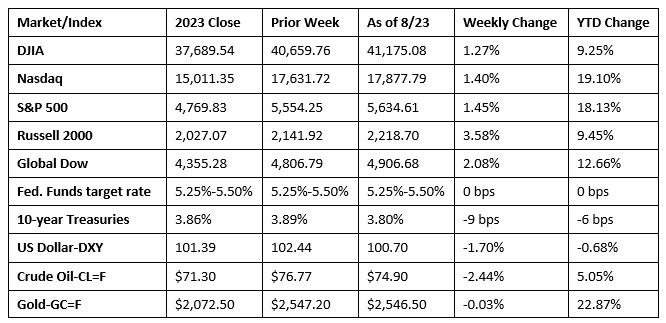
Chart reflects price changes, not total return. Because it does not include dividends or splits, it should not be used to benchmark performance of specific investments.
Last Week’s Economic News
- Sales of existing homes increased in July for the first time since February. Existing home sales rose 1.3% in July. Year over year, sales were down 2.5%. Total inventory sat at a 4.0-month supply. The median existing home price was $422,600 in July, down from June’s $426,900 but above the July 2023 price of $405,600. Sales of single-family homes advanced 1.4% in July but declined 1.4% from a year ago. The median existing single-family home price was $428,500 last month, down from the June estimate of $432,900 but above the July 2023 price of $411,200. As of August 15, the 30-year fixed-rate mortgage averaged 6.49%, according to Freddie Mac, which was up from 6.47% one week ago, but down from 7.09% from a year ago.
- Sales of new single-family homes also picked up steam in July, climbing 10.6% for the month and 5.6% above the total from the previous year. The median sales price of new houses sold in July was $429,800. The average sales price was $514,800. The inventory of new single-family homes available for sale represented a 7.5-month supply at the current sales rate.
- The national average retail price for regular gasoline was $3.382 per gallon on August 19, $0.032 per gallon under the prior week’s price and $0.486 per gallon less than a year ago. Also, as of August 19, the East Coast price fell $0.027 to $3.299 per gallon; the Midwest price decreased $0.072 to $3.322 per gallon; the Gulf Coast price dipped $0.003 to $2.996 per gallon; the Rocky Mountain price increased $0.057 to $3.471 per gallon; and the West Coast price decreased $0.014 to $4.058 per gallon.
- For the week ended August 17, there were 232,000 new claims for unemployment insurance, an increase of 4,000 from the previous week’s level, which was revised up by 1,000. According to the Department of Labor, the advance rate for insured unemployment claims for the week ended August 10 was 1.2%, unchanged from the previous week’s rate. The advance number of those receiving unemployment insurance benefits during the week ended August 10 was 1,863,000, an increase of 4,000 from the previous week’s level, which was revised down by 5,000. This is the highest level for insured unemployment since November 27, 2021, when it was 1,878,000. States and territories with the highest insured unemployment rates for the week ended August 3 were New Jersey (2.8%), Puerto Rico (2.6%), Rhode Island (2.6%), California (2.2%), Minnesota (2.0%), Pennsylvania (1.9%), Connecticut (1.8%), Massachusetts (1.7%), Nevada (1.7%), New York (1.7%), and Washington (1.7%). The largest increases in initial claims for unemployment insurance for the week ended August 10 were in Georgia (+693), Michigan (+584), Virginia (+357), New Jersey (+339), and Kansas (+233), while the largest decreases were in California (-2,585), Texas (-1,438), Massachusetts (-972), Pennsylvania (-604), and Iowa (-508).
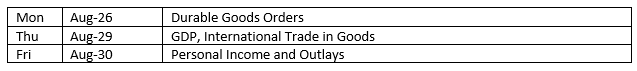
Eye on the Week Ahead
The second release of gross domestic product for quarter two is out this week. The initial estimate showed the economy expanded at an annualized rate of 2.8%. Also out this week is the report on personal income and outlays for July, which is also a potential market mover. One of the most important parts of the report is the personal consumption expenditures price index, a measure of inflation favored by the Federal Reserve. In June, consumer prices ticked up 0.1% and rose 2.5% for the year ended in June.
The Week Ahead
The information provided is obtained from sources believed to be reliable. Forecasts cannot be guaranteed. Past performance is not a guarantee of future results.
© 2021 Broadridge Financial Solutions, Inc. All Rights Reserved.