Despite moments of trepidation, the stock market extended its winning streak to three straight weeks. And even with its rough start, August marked the fourth month in a row of positive returns. Several encouraging reports suggested that the economy is holding up and inflation is moderating, keeping alive hopes of a soft landing and a September rate cut by the Federal Reserve. The Dow posted the largest gain to close out the week at an all-time high, and the Global Dow also soared. The large caps of the S&P 500 posted a modest gain, the small caps of the Russell 2000 treaded water, and the tech-heavy NASDAQ ended the week in the red. Financials, energy, and materials were the top performing sectors, while information technology and communication services lagged. Bond prices fell, pushing up 10-year Treasury yields. Regardless of heightened geopolitical tensions, crude oil prices slipped due to expectations of weaker global demand. Gold prices fell and the dollar rose.
Stocks couldn’t maintain their momentum last Monday, though the Dow (0.2%) and the Global Dow (0.1%) pulled off slight gains. Declining tech stocks dragged down the NASDAQ (-0.9%), while the Russell 2000 (-0.4%) and the S&P 500 (-0.3%) also posted losses. The 10-year Treasury yield fell to 3.82%. Crude oil spiked more than 2.9% on the news that Libya would halt exports. Gold prices and the dollar also rose.
The Global Dow (0.4%), the NASDAQ (0.2%), and the S&P 500 (0.2%) all closed higher on Tuesday, while the Russell 2000 declined 0.7%. The Dow ended the day where it began, sitting at an all-time high. The 10-year Treasury yield rose slightly to 3.82%. Crude oil prices dropped 2.2% to about $75 per barrel. Gold prices advanced and the dollar retreated.
Last Wednesday, all of the benchmark stock indexes listed here ended up in the red. The NASDAQ fell 1.1%, followed by the Russell 2000 (-0.7%), the S&P 500 (-0.6%), the Dow (-0.4%), and the Global Dow (-0.3%). The 10-year Treasury yield ticked up again to 3.84%. Crude oil prices fell more than 1.5%. Gold lost value and the dollar advanced.
Stock market returns were mostly positive on Thursday, with one major exception. Shares of a high-profile chipmaker sold off due to a disappointing forecast, even though it reported second-quarter earnings that beat expectations. Those losses weighed on the NASDAQ, which fell 0.2%. The S&P 500 and the Global Dow both ended the day flat. The small caps of the Russell 2000 posted a 0.7% gain, followed closely by the Dow, which climbed 0.6% to reach another record high. The yield on 10-year Treasuries inched up for the third-straight day to close at 3.86%. Crude oil prices rose nearly 2.0%, settling just under $76.00 per barrel. Gold prices and the dollar also advanced.
Investors kicked off the holiday weekend in good spirits on Friday, after the Fed’s preferred gauge pointed to tamer inflation.(See below.) All of the major stock indexes listed here closed higher. The NASDAQ gained 1.1% and the S&P 500 rose 1.0%, followed by the Russell 2000, which climbed 0.7%. The Global Dow and the Dow returned 0.6%. The benchmark 10-year Treasury yield added 4.4 basis points and settled at 3.91%. Crude oil prices dropped 3.0% and Gold prices fell 1.0%, while the dollar edged up slightly.
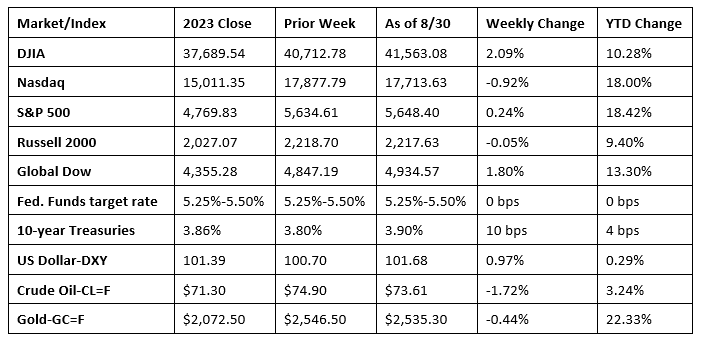
Chart reflects price changes, not total return. Because it does not include dividends or splits, it should not be used to benchmark performance of specific investments.
Last Week’s Economic News
- The economy grew at an annualized rate of 3.0% in the second quarter according to the second estimate of gross domestic product. GDP accelerated at a rate of 1.4% in the first quarter. The personal consumption expenditures (PCE) price index increased 2.5%. Excluding food and energy prices, the PCE price index increased 2.8%. Consumer spending, as measured by the personal consumption expenditures index, rose 2.9%. Spending on goods increased 3.0%, while spending on services climbed 2.9%. Residential fixed investment declined 2.0%, while nonresidential (business) fixed investment increased 4.6%. Exports rose 1.6% and imports, which are a negative in the calculation of GDP, jumped 7.0%.
- Prices consumers paid for goods and services, as measured by the personal consumption expenditures (PCE) price index, rose 0.2% in July following a 0.1% increase in June. Excluding food and energy, prices increased 0.2%. Over the 12 months ended in July, the PCE price index rose 2.5%, the same as the 12-month estimate for the period ended in June. Prices for goods decreased by less than 0.1%, and prices for services increased 3.7%. The July 12-month increase in prices excluding food and energy was 2.6%, unchanged from the 12 months ended in June. Also in July, personal income increased 0.3%, while disposable personal income advanced 0.3%. Consumer spending, as measured by the personal consumption expenditures (PCE) index, increased 0.5% in July, up from the June estimate of 0.3%.
- Durable goods orders shot up 9.9% in July after dropping 6.9% in June. Excluding transportation, new orders decreased 0.2%. Excluding defense, new orders increased 10.4%. The 34.8% jump in new orders for transportation equipment (mainly aircraft) drove the overall increase in July. New orders for nondefense capital goods in July increased 41.9%.
- According to the advance report on international trade in goods (excluding services), the deficit for July widened by $6.1 billion, or 6.3%, from June. Exports were virtually unchanged, while imports decreased $6.1 billion, or 2.3%. Since July 2023, exports have risen 4.4% and imports have surged 8.2%.
- The national average retail price for regular gasoline was $3.313 per gallon on August 26, $0.069 per gallon under the prior week’s price and $0.500 per gallon less than a year ago. Also, as of August 26, the East Coast price fell $0.045 to $3.254 per gallon; the Midwest price decreased $0.114 to $3.208 per gallon; the Gulf Coast price dipped $0.102 to $2.894 per gallon; the Rocky Mountain price increased $0.114 to $3.357 per gallon; and the West Coast price decreased $0.008 to $4.050 per gallon.
- For the week ended August 24, there were 231,000 new claims for unemployment insurance, a decrease of 2,000 from the previous week’s level, which was revised up by 1,000. According to the Department of Labor, the advance rate for insured unemployment claims for the week ended August 17 was 1.2%, unchanged from the previous week’s rate. The advance number of those receiving unemployment insurance benefits during the week ended August 17 was 1,868,000, an increase of 13,000 from the previous week’s level, which was revised down by 8,000. States and territories with the highest insured unemployment rates for the week ended August 10 were New Jersey (2.8%), Rhode Island (2.5%), California (2.2%), Puerto Rico (2.1%), Minnesota (2.0%), Connecticut (1.8%), Massachusetts (1.8%), Pennsylvania (1.8%), Nevada (1.7%), New York (1.7%), and Washington (1.7%). The largest increases in initial claims for unemployment insurance for the week ended August 17 were in Florida (+2,153), California (+979), Indiana (+854), South Carolina (+645), and Virginia (+408), while the largest decreases were in Michigan (-2,847), Texas (-1,952), New Jersey (-1,010), Georgia (-979), and Puerto Rico (-779).
Eye on the Week Ahead
Results from the August purchasing managers’ indexes (PMI) for manufacturing and services will be released this week. Two important employment reports for August are also coming out. Labor market data is highly anticipated at this critical juncture for the economy, especially after last month’s disappointing jobs report raised expectations that the Federal Reserve will cut interest rates substantially in September.
The Week Ahead

The information provided is obtained from sources believed to be reliable. Forecasts cannot be guaranteed. Past performance is not a guarantee of future results.
© 2021 Broadridge Financial Solutions, Inc. All Rights Reserved.