Despite a tepid start, stocks ended last week generally higher. Each of the benchmark indexes listed here posted solid gains with the Dow and the S&P 500 reaching record highs on multiple occasions. Financials and information technology led the market sectors, with consumer discretionary, real estate, communication services, utilities, and energy losing ground. Crude oil prices rose for the second straight week, fueled by escalating tensions in the Middle East and increased fuel demand in Florida on the heels of Hurricane Milton. The dollar and gold prices increased.
Wall Street began the week tumbling lower as investors pondered a further escalation of tensions in the Middle East. All of the benchmark indexes listed here lost value, with the NASDAQ falling 1.2% followed by the S&P 500, which dropped 1.0%. The Dow and the Russell 2000 lost 0.9%, while the Global Dow dipped 0.1%. Long-term bond values also declined, with yields on 10-year Treasuries climbing to 4.02%, the highest since late July, as the strong labor report dampened any chance of another interest rate cut in November. Crude oil prices climbed to $77.38 per barrel, a six-week high, based on fears that a broader conflict in the Middle East could include strikes on Iran’s oil fields. The dollar and gold prices marginally decreased.
Last Tuesday saw stocks rebound, driven by a rally in tech shares. The NASDAQ added 1.5%, the S&P 500 rose 1.0%, the Dow climbed 0.3%, and the Russell 2000 eked out a 0.1% gain. The Global Dow fell 0.5%. Ten-year Treasury yields ticked up to 4.03%. The dollar slipped 0.1%, while gold prices fell 0.9%. Crude oil prices tumbled 4.2% to $73.90 per barrel.
Both the Dow (1.0%) and the S&P 500 (0.7%) climbed to new record highs last Wednesday, ahead of the Consumer Price Index report for September. Investors and forecasters expect the latest data to show that inflation slowed in September. The NASDAQ gained 0.6%, the Global Dow rose 0.4%, and the Russell 2000 inched up 0.3%. Ten-year Treasury yields continued to advance, closing at 4.06%. Crude oil prices slipped 0.2%, settling at $73.46 per barrel. The dollar increased 0.4%, while gold prices fell 0.3%.
Stocks closed slightly lower last Thursday as investors mulled the latest Consumer Price Index, which slowed to its lowest rate since the beginning of 2021, but marginally exceeded market expectations (see below). The Russell 2000 fell 0.6% and the S&P 500 lost 0.2%. The NASDAQ, the Dow, and the Global Dow all declined 0.1% or less. Ten-year Treasury yields ticked up 2.9 basis points to 4.09%. Crude oil prices, driven by rising U.S. demand in the aftermath of Hurricanes Helene and Milton, gained 3.7%, settling at $75.93 per barrel. The dollar fell 0.1%, while gold prices rose 0.8% to $2,647.00 per ounce after sliding to a three-week low in the prior session.
Last Friday saw both the Dow and the S&P 500 reach new record highs. Stocks closed generally higher to end the week as third-quarter earnings season got off on the right foot, with some major banks reporting stronger-than-expected results. The small caps of the Russell 2000 gained 2.1%, the Dow rose 1.0%, the S&P 500 added 0.6%, the Global Dow climbed 0.5%, and the NASDAQ advanced 0.3%. The yield on 10-year Treasuries rose to 4.11% during the session, only to slip back to 4.09%. Crude oil prices fell 0.4%, the dollar slid 0.1%, while gold prices moved up 1.3%.
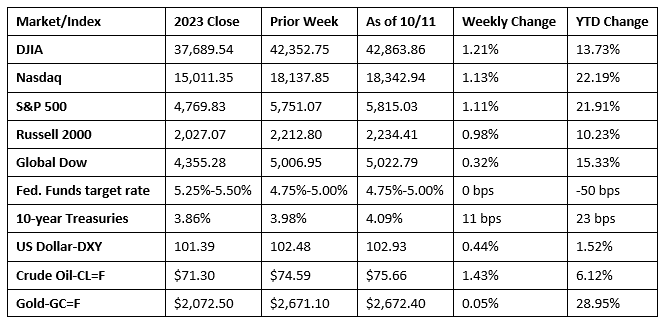
Chart reflects price changes, not total return. Because it does not include dividends or splits, it should not be used to benchmark performance of specific investments.
Last Week’s Economic News
- The Consumer Price Index rose 0.2% in September, the same increase as in August and July. Prices for shelter rose 0.2% in September and prices for food rose 0.4%. Together, they contributed over 75% of the monthly all items increase. Consumer prices, less food and energy rose 0.3% in September, the same increase as in August. Energy prices fell 1.9% last month after declining 0.8% in August. The all items index rose 2.4% for the 12 months ended September, the smallest 12-month increase since February 2021. Prices less food and energy rose 3.3% over the last 12 months.
- The Producer Price Index was unchanged in September after advancing 0.2% in August. For the year, producer prices rose 1.8%. In September, prices for services rose 0.2% but were offset by a 0.2% decline in prices for goods. Producer prices less foods, energy, and trade services inched up 0.1% in September after rising 0.2% in August. For the 12 months ended in September, prices less foods, energy, and trade services increased 3.2%.
- The report on international trade in goods and services, released October 8, revealed that the trade deficit in August was $70.4 billion, down $8.5 billion, or 10.8%, from the July estimate. August exports were $271.8 billion, $5.3 billion, or 2.0%, more than July exports. August imports were $342.2 billion, $3.2 billion, or 0.9%, less than July imports. Year to date, the goods and services deficit increased $47.1 billion, or 8.9%, from the same period in 2023. Exports increased $79.0 billion, or 3.9%. Imports increased $126.1 billion, or 4.9%.
- The national average retail price for regular gasoline was $3.136 per gallon on October 7, $0.043 per gallon below the prior week’s price and $0.548 per gallon less than a year ago. Also, as of October 7, the East Coast price fell $0.051 to $3.009 per gallon; the Midwest price decreased $0.069 to $3.036 per gallon; the Gulf Coast price rose $0.030 to $2.725 per gallon; the Rocky Mountain price dipped $0.144 to $3.271 per gallon; and the West Coast price decreased $0.015 to $4.027 per gallon.
- For the week ended October 5, there were 258,000 new claims for unemployment insurance, an increase of 33,000 from the previous week’s level. This is the highest level for initial claims since August 5, 2023. According to the Department of Labor, the advance rate for insured unemployment claims for the week ended September 28 was 1.2%, unchanged from the previous week’s rate. The advance number of those receiving unemployment insurance benefits during the week ended September 28 was 1,861,000, an increase of 42,000 from the previous week’s level, which was revised down by 7,000. States and territories with the highest insured unemployment rates for the week ended September 21 were New Jersey (2.2%), California (2.0%), Puerto Rico (1.9%), Rhode Island (1.8%), Washington (1.7%), Nevada (1.6%), Massachusetts (1.5%), New York (1.5%), Illinois (1.4%), Connecticut (1.3%), and Pennsylvania (1.3%). The largest increases in initial claims for unemployment insurance for the week ended September 28 were in Michigan (+1,187), Washington (+892), Indiana (+657), California (+638), and Iowa (+568), while the largest decreases were in Georgia (-1,237), Florida (-919), Texas (-532), Virginia (-481), and New York (-451).
Eye on the Week Ahead
The report on import and export prices for September is available this week. August saw a decrease in both import and export prices. The retail sales report for September is also out this week. Retail and food services sales ticked up 0.1% in August, beating expectations of forecasters. Industrial production rebounded in August after lagging in July. Finally, the September report on housing starts, building permits, and housing completions is released this week. Receding mortgage rates have renewed builder confidence, which led to a rise in building permits and housing starts in August.
The Week Ahead

The information provided is obtained from sources believed to be reliable. Forecasts cannot be guaranteed. Past performance is not a guarantee of future results.
© 2021 Broadridge Financial Solutions, Inc. All Rights Reserved.