Wall Street enjoyed one of its best weeks in quite some time as stocks moved higher by the close of trading last Friday. Each of the benchmark indexes posted solid weekly gains on the heels of easing U.S.-China trade tensions. The 90-day tariff truce helped drive the S&P 500 back into positive territory for the year. Most of the market sectors experienced growth, with the exception of health care. Consumer discretionary and information technology led the advance, each climbing more than 7.0%. Weaker-than-expected economic reports (see below) chilled investor enthusiasm somewhat, despite the favorable tariff news. Crude oil prices moved higher for the second consecutive week. While easing global tensions helped stocks, gold prices slipped lower. After reaching a three-month high of 4.55% last Thursday, yields on 10-year bonds dipped by the end of the week. Nevertheless, yields closed the week more than 20 basis points higher than their values at the start of May.
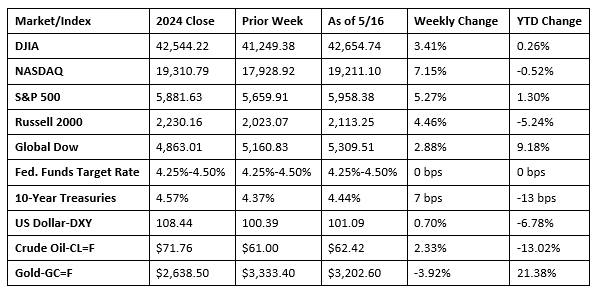
Chart reflects price changes, not total return. Because it does not include dividends or splits, it should not be used to benchmark performance of specific investments.
Last Week’s Economic News
- Consumer prices ticked up 0.2% in April after falling 0.1% in the previous month, according to the latest Consumer Price Index. Over the last 12 months, consumer prices have risen 2.3% following a 2.4% increase for the 12 months ended in March. The April change was the smallest 12-month increase in the CPI since February 2021. The all items less food and energy index rose 2.8% over the last 12 months. More than half of the April price increase was attributable to a 0.3% rise in shelter prices. Prices for energy also rose 0.7% last month. Food prices, in contrast, fell 0.1% in April. Consumer prices less food and energy rose 0.2% in April following a 0.1% increase in March.
- Prices received by producers of goods, services, and construction (generally, wholesale prices) decreased 0.5% in April, which was largely attributable to a 0.7% drop in prices for services. This was the largest decline in prices for services since December 2009. Prices received for goods were unchanged from the prior month. Since April 2024, producer prices have risen 2.4%. Prices less foods, energy, and trade services edged down 0.1% in April, the first decline since April 2020. For the 12 months ended April 2025, prices less foods, energy, and trade services advanced 2.9%.
- According to the latest report from the Census Bureau, retail and food services sales ticked up 0.1% in April from the previous month and rose 5.2% from April 2024. Retail trade sales were down 0.1% from March but were up 4.7% from last year. Sales for motor vehicle and parts dealers were up 9.4% from last year, while food service and drinking places sales rose 7.8% over the last 12 months.
- Total industrial production was unchanged in April, according to the latest information from the Federal Reserve. Manufacturing declined 0.4% and mining fell 0.3%. These decreases were offset by a 3.3% increase in utilities. Over the 12 months ended in April, total industrial production rose 1.5%, manufacturing increased 1.2%, mining inched up 0.7%, and utilities advanced 4.3%.
- Import prices increased 0.1% in April following a 0.4% decrease in March. Higher prices for nonfuel imports more than offset lower prices for fuel imports in April. Prices for nonfuel imports increased 0.4% in April following a decrease of 0.1% in March. Import prices rose 0.1% from April 2024 to April 2025. Prices for exports advanced 0.1% in April for the second consecutive month. Prices for exports have not declined on a one-month basis since September 2024. Export prices advanced 2.0% from April 2024 to April 2025.
- The federal government had a $258 billion surplus in April, of which $537 billion was attributable to income tax receipts. By comparison, the surplus in April 2024 was $210 billion. For fiscal year 2025, the deficit sits at $1,049 billion. Over the same period last fiscal year, the deficit was $855 billion.
- The number of residential building permits issued in April declined 4.7% from the previous month’s estimate. Residential building permits were also 3.2% below the year-earlier figure. Single-family permits in April were 5.1% below the revised March figure. Privately-owned housing starts in April were 1.6% above the March estimate but 1.7% below the April 2024 rate. Single-family housing starts in April were 2.1% below the revised March figure. Privately-owned housing completions in April were 5.9% below the revised March estimate and 12.3% below the April 2024 figure. Single-family housing completions in April were 8.0% below the revised March rate.
- The national average retail price for regular gasoline was $3.120 per gallon on May 12, $0.027 per gallon below the prior week’s price and $0.488 per gallon less than a year ago. Also, as of May 12, the East Coast price ticked down $0.051 to $2.947 per gallon; the Midwest price decreased $0.049 to $2.978 per gallon; the Gulf Coast price fell $0.030 to $2.692 per gallon; the Rocky Mountain price increased $0.019 to $3.137 per gallon; and the West Coast price rose $0.068 to $4.224 per gallon.
- For the week ended May 10, there were 229,000 new claims for unemployment insurance, unchanged from the previous week’s level, which was revised up by 1,000. According to the Department of Labor, the advance rate for insured unemployment claims for the week ended May 3 was 1.2%, unchanged from the previous week’s rate. The advance number of those receiving unemployment insurance benefits during the week ended May 3 was 1,881,000, an increase of 9,000 from the previous week’s level, which was revised down by 7,000. States and territories with the highest insured unemployment rates for the week ended April 26 were New Jersey (2.4%), California (2.2%), Washington (2.1%), Rhode Island (2.0%), the District of Columbia (1.8%), Massachusetts (1.8%), Illinois (1.7%), New York (1.7%), Minnesota (1.6%), Nevada (1.6%), Oregon (1.6%), and Puerto Rico (1.6%). The largest increases in initial claims for unemployment insurance for the week ended May 3 were in Michigan (+6,869), California (+1,187), Maryland (+1,073), Texas (+930), and Florida (+584), while the largest decreases were in New York (-15,228), Massachusetts (-3,993), New Jersey (-3,243), South Carolina (-1,049), and Connecticut (-895).
Eye on the Week Ahead
The housing sector is front and center this week. The latest data on sales of new and existing homes is available for April. Sales of existing homes fell in March, while sales of new single-family homes rose. Higher mortgage lending rates have kept some potential homebuyers away over the past several months.
The Week Ahead

The information provided is obtained from sources believed to be reliable. Forecasts cannot be guaranteed. Past performance is not a guarantee of future results.
© 2021 Broadridge Financial Solutions, Inc. All Rights Reserved.