Stocks closed the week with mixed results as investors weighed the escalating tensions in the Middle East against the likelihood of the Federal Reserve cutting interest rates amidst an apparent disagreement between Federal Reserve governors. The Dow, the NASDAQ, and the Russell 2000 closed the week higher, while the S&P 500 and the Global Dow ended the week in the red. Information technology and energy were the only market sectors to finish the week higher. Health care fell by more than 2.5%. Crude oil prices rose for the third straight week as heightened tensions between Iran and Israel threatened supply disruptions, although Iran continued to export crude oil, reaching its highest level in five weeks. Gold prices marked their first decline in the last three weeks. Long-term bond prices climbed on increased demand, pulling yields lower.
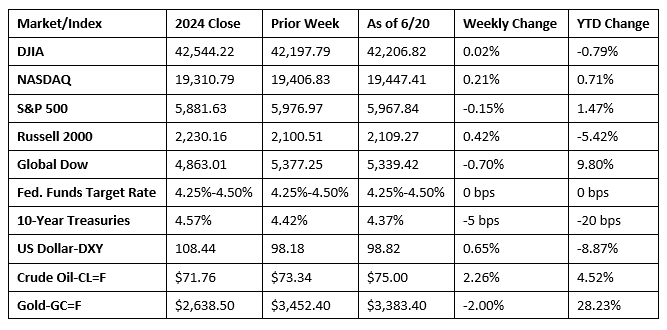
Chart reflects price changes, not total return. Because it does not include dividends or splits, it should not be used to benchmark performance of specific investments.
Last Week’s Economic News
- The Federal Open Market Committee (FOMC) decided to maintain the target range for the federal funds rate at 4.25%-4.50% following its meeting last week. In reaching its decision, the Committee noted that economic activity has continued to expand at a solid pace, although swings in net exports have affected the data. The unemployment rate remained low and labor market conditions continued to be solid, while inflation was somewhat elevated. The FOMC observed that uncertainty about the economic outlook had diminished but remained prevalent. The Committee’s summary of economic conditions projects two rate cuts of 25 basis points each by the end of 2025. The FOMC next meets on July 30.
- Retail sales fell 0.9% in May from the previous month but were 3.3% above the May 2024 estimate. Retail trade sales were down 0.9% last month but were up 3.0% from last year. Nonstore (online) retail sales climbed 0.9% in May and advanced 8.3% from last year, while sales at food service and drinking places fell 0.9% in May but rose 5.3% from May 2024.
- Prices for imports were unchanged in May following an advance of 0.1% in April. Import prices rose 0.2% from May 2024. Import fuel prices declined 4.0% in May, the largest monthly decline since September 2024. Prices for nonfuel imports advanced 0.3% in May and rose 1.7% over the last 12 months. Prices for exports decreased 0.9% in May, the largest one-month decline since October 2023. Despite the May decline, export prices increased 1.7% from May 2024 to May 2025.
- Industrial production (IP) fell 0.2% in May after increasing 0.1% in April. Manufacturing output ticked up 0.1% in May, driven by a 4.9% gain in motor vehicles and parts. Manufacturing excluding motor vehicles and parts fell 0.3%. Mining increased 0.1% last month, while utilities decreased 2.9%. Total IP in May was 0.6% above its year-earlier level.
- Building permits issued for privately-owned homes in May were 2.0% below the April rate and 1.0% under the May 2024 estimate. Issued building permits for single-family homes in May were 2.7% below the April total. Privately-owned housing starts in May were 9.8% below the April estimate and 4.6% less than May 2024. The drop in housing starts in May marked the lowest level since May 2020. Single-family housing starts in May were 0.4% above the April approximation. Privately-owned housing completions in May were 5.4% above the April estimate but 2.2% below the May 2024 figure. Single-family housing completions in May were 8.1% above the April rate.
- The national average retail price for regular gasoline was $3.139 per gallon on June 16, $0.031 per gallon above the prior week’s price but $0.296 per gallon less than a year ago. Also, as of June 16, the East Coast price increased $0.034 to $2.983 per gallon; the Midwest price climbed $0.060 to $3.026 per gallon; the Gulf Coast price increased $0.019 to $2.735 per gallon; the Rocky Mountain price rose $0.029 to $3.114 per gallon; and the West Coast price declined $0.027 to $4.127 per gallon.
- For the week ended June 14, there were 245,000 new claims for unemployment insurance, a decrease of 5,000 from the previous week’s level, which was revised up by 2,000. According to the Department of Labor, the advance rate for insured unemployment claims for the week ended June 7 was 1.3%, unchanged from the previous week’s rate. The advance number of those receiving unemployment insurance benefits during the week ended June 7 was 1,945,000, a decrease of 6,000 from the previous week’s level, which was revised down by 5,000. States and territories with the highest insured unemployment rates for the week ended May 31 were New Jersey (2.3%), California (2.2%), Massachusetts (2.1%), Washington (2.1%), Rhode Island (2.0%), the District of Columbia (1.9%), Nevada (1.7%), Puerto Rico (1.7%), Illinois (1.6%), and New York (1.6%). The largest increases in initial claims for unemployment insurance for the week ended June 7 were in California (+8,930), Minnesota (+4,809), Pennsylvania (+3,939), Texas (+3,355), and Florida (+3,088), while the largest decreases were in Kentucky (-4,249), North Dakota (-980), Tennessee (-693), Mississippi (-273), and Kansas (-178).
Eye on the Week Ahead
This week is loaded with important, potentially market-moving economic data. The latest data on sales of new and existing homes is available at the beginning of the week. The final estimate of gross domestic product for the first quarter is released midweek. The week ends with the release of the latest data covering personal income, consumer spending, and consumer prices.
The Week Ahead

The information provided is obtained from sources believed to be reliable. Forecasts cannot be guaranteed. Past performance is not a guarantee of future results.
© 2021 Broadridge Financial Solutions, Inc. All Rights Reserved.