Wall Street has come a long way from an April sell-off as investor optimism over trade agreements and a cooling of tensions in the Middle East helped lift stocks to record highs last week. The S&P 500 and the NASDAQ each hit new highs. Despite inflationary data coming in slightly above expectations, price pressures remained mostly muted (see below). Several market sectors enjoyed notable gains, led by information technology and financials. Energy and real estate moved lower last week. Crude oil prices, which had been surging, had their worst week since March 2023. Gold lost value for the second straight week as global tensions eased, leading to an increase in global trade that reduced the appeal of safe-haven investments. The dollar continued to tumble, hovering near its lowest level since early 2022. With inflation ticking higher in May, coupled with a decrease in consumer spending and a larger-than-expected contraction in first-quarter gross domestic product, the Federal Reserve may be inclined to resume its interest-rate cutting cycle sooner rather than later.
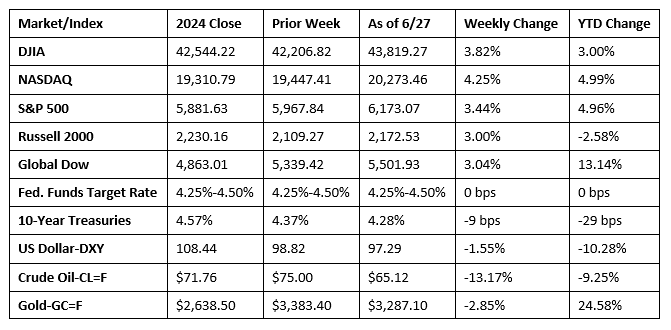
Chart reflects price changes, not total return. Because it does not include dividends or splits, it should not be used to benchmark performance of specific investments.
Last Week’s Economic News
- The third and final estimate for first-quarter gross domestic product saw the economy contract 0.5%. Compared to the fourth quarter, when GDP rose 2.4%, the downturn in first-quarter GDP primarily reflected an upturn in imports, which are a negative in the calculation of GDP, a decrease in consumer spending, and a downturn in government spending, which was partly offset by an increase in fixed investment. The increase in imports was likely attributable, in large part, to purchases made in anticipation of price increases due to tariffs. It is expected that growth in imports will slow in the second quarter. Consumer spending, which is a major component of GDP, moved from a 4.0% increase in the fourth quarter to a 0.5% bump in the first quarter.
- Personal income decreased 0.4% in May, according to estimates by the U.S. Bureau of Economic Analysis. Disposable (after-tax) personal income declined 0.6%, while personal consumption expenditures (PCE) decreased 0.1%. The PCE price index for May increased 0.1%. Excluding food and energy, the PCE price index increased 0.2%. Over the last 12 months, the PCE price index increased 2.3%, while prices excluding food and energy rose 2.7%.
- The international trade in goods deficit was $96.6 billion in May, up $9.6 billion, or 11.1%, from April. Exports of goods for May were $179.2 billion, $9.7 billion, or 5.2%, less than April exports. Imports of goods for May were $275.8 billion, essentially unchanged from April imports. Over the last 12 months, exports have risen 6.2%, while imports advanced 2.8%.
- New orders for long-lasting manufactured goods soared 16.4% in May after falling 6.6% in April. New orders for durable goods have risen five of the last six months. New orders for transportation equipment surged 48.3% in May, driving the overall increase for the month. Excluding transportation equipment, new orders ticked up 0.5% last month. Excluding defense, new orders increased 15.5%. Since May 2024, new orders for durable goods rose 6.9%.
- Sales of new single-family houses in May were 13.7% below the April rate and were 6.3% under the May 2024 rate. The estimate of new houses for sale at the end of May represented a supply of 9.8 months at the current sales rate. The month’s supply was above the April estimate of 8.3 months and higher than the May 2024 estimate of 8.5 months. The median sales price of new houses sold in May was $426,600. This is 3.7% above the April price of $411,400 and is 3.0% above the May 2024 price of $414,300. The average sales price of new houses sold in May was $522,200. This is 2.2% above the April price of $511,200 and is 4.6% over the May 2024 price of $499,300.
- Sales of existing homes beat market expectations after unexpectedly rising 0.8% in May, rebounding from April’s 0.5% decline. Despite the May advance, existing home sales were 0.7% below the estimate from a year earlier. Inventory of existing homes for sale ticked up to 4.6 months, slightly higher than the April estimate of 4.4 months. The median existing home sales price in May was $422,800, up from $414,000 in April and higher than the May 2024 price of $417,200. Sales of existing single-family homes rose 1.1% in May and were 0.3% higher than the May 2024 estimate. The median single-family home price in May was $427,800, higher than the April price of $418,000 and above the $422,400 estimate from a year ago.
- The national average retail price for regular gasoline was $3.213 per gallon on June 23, $0.074 per gallon above the prior week’s price but $0.225 per gallon less than a year ago. Also, as of June 23, the East Coast price increased $0.089 to $3.072 per gallon; the Midwest price climbed $0.061 to $3.087 per gallon; the Gulf Coast price increased $0.109 to $2.844 per gallon; the Rocky Mountain price rose $0.063 to $3.177 per gallon; and the West Coast price increased $0.035 to $4.162 per gallon.
- For the week ended June 21, there were 236,000 new claims for unemployment insurance, a decrease of 10,000 from the previous week’s level, which was revised up by 1,000. According to the Department of Labor, the advance rate for insured unemployment claims for the week ended June 14 was 1.3%, unchanged from the previous week’s rate. The advance number of those receiving unemployment insurance benefits during the week ended June 14 was 1,974,000, an increase of 37,000 from the previous week’s level, which was revised down by 8,000. This is the highest level for insured unemployment since November 6, 2021, when it was 2,041,000. States and territories with the highest insured unemployment rates for the week ended June 7 were New Jersey (2.2%), California (2.1%), Massachusetts (2.0%), Rhode Island (2.0%), Washington (2.0%), the District of Columbia (1.9%), Minnesota (1.9%), Puerto Rico (1.9%), Illinois (1.6%), Nevada (1.6%), New York (1.6%), Oregon (1.6%), and Pennsylvania (1.6%). The largest increases in initial claims for unemployment insurance for the week ended June 14 were in Pennsylvania (+3,863), Connecticut (+1,750), Oregon (+1,258), Minnesota (+1,173), and Wisconsin (+846), while the largest decreases were in Illinois (-1,978), California (-1,933), New York (-1,402), Georgia (-1,200), and Iowa (-1,197).
Eye on the Week Ahead
Fourth of July week brings with it the June employment report. Total employment has been steadily dwindling over the past few months. April saw 147,000 (revised lower) new jobs added, while there were 139,000 new jobs reported in May.
The Week Ahead

The information provided is obtained from sources believed to be reliable. Forecasts cannot be guaranteed. Past performance is not a guarantee of future results.
© 2021 Broadridge Financial Solutions, Inc. All Rights Reserved.