Last week, the Trump administration sent letters to dozens of trading partners informing them of country-specific reciprocal tariff rates ranging from 20% to 50%. The levies were initially slated to take effect on July 9, but were pushed back until August 1, presumably to leave room for continued negotiations. The stock market seemed to shrug off tariff news for much of the week before falling back from Thursday’s record highs on Friday and ending slightly in the red. The dollar and gold prices both advanced during the week. U.S. copper prices soared to all-time highs on Tuesday after President Trump said the United States will impose a 50% tariff on imported copper, a metal that is a critical component in many different types of manufactured goods. And on Friday, Trump announced that a major statement on Russia was forthcoming, which led to a spike in oil prices caused by expectations of additional sanctions on Russian energy.
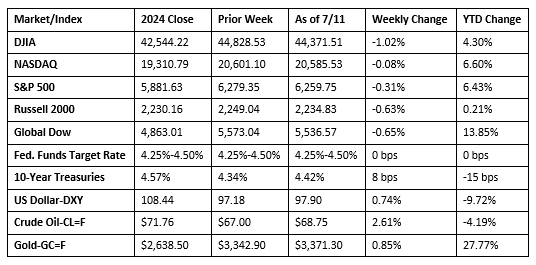
Chart reflects price changes, not total return. Because it does not include dividends or splits, it should not be used to benchmark performance of specific investments.
Last Week’s Economic News
- The Treasury budget posted a small surplus of $27.0 billion in June, following May’s $315.7 billion deficit. For fiscal year 2025, the deficit sits at $1,337 billion, compared to $1,273 billion over the same period in the prior fiscal year. To date in FY25, total receipts equaled $4,008 billion, while total outlays were $5,345 billion.
- The national average retail price for regular gasoline was $3.125 per gallon on July 7, $0.039 per gallon below the prior week’s price and $0.364 per gallon less than a year ago. Also, as of July 7, the East Coast price decreased $0.011 to $3.020 per gallon; the Midwest price dropped $0.070 to $2.981 per gallon; the Gulf Coast price declined $0.054 to $2.685 per gallon; the Rocky Mountain price dipped $0.042 to $3.133 per gallon; and the West Coast price fell $0.034 to $4.075 per gallon.
- For the week ended July 5, there were 227,000 new claims for unemployment insurance, a decrease of 5,000 from the previous week’s level, which was revised down by 1,000. According to the Department of Labor, the advance rate for insured unemployment claims for the week ended June 28 was 1.3%, unchanged from the previous week’s rate. The advance number of those receiving unemployment insurance benefits during the week ended June 28 was 1,965,000, an increase of 10,000 from the previous week’s level, which was revised down by 9,000. This is the highest level for insured unemployment since November 13, 2021. States and territories with the highest insured unemployment rates for the week ended June 21 were Puerto Rico (2.4%), Minnesota (2.3%), New Jersey (2.3%), California (2.2%), Rhode Island (2.2%), Washington (2.0%), the District of Columbia (1.9%), Massachusetts (1.9%), Oregon (1.8%), and Pennsylvania (1.8%). The largest increases in initial claims for unemployment insurance for the week ended June 28 were in New Jersey (+4,684), New York (+3,323), Illinois (+1,840), Michigan (+826), and Rhode Island (+587), while the largest decreases were in Pennsylvania (-2,910), California (-2,822), Connecticut (-2,407), Minnesota (-1,508), and Wisconsin (-1,036).
Eye on the Week Ahead
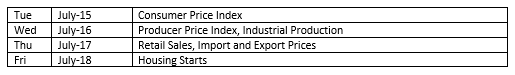
Inflation data for June is available this week with the releases of the Consumer Price Index, the Producer Price Index, and the retail sales report. Overall, inflationary pressures have been generally muted; however, prices ticked up in May. The June data could begin to reflect the impact of tariffs on goods and services prices.
The Week Ahead
The information provided is obtained from sources believed to be reliable. Forecasts cannot be guaranteed. Past performance is not a guarantee of future results.
© 2021 Broadridge Financial Solutions, Inc. All Rights Reserved.