Stocks began last week mostly lower on mixed bank earnings and rising inflation data. While the June Consumer Price Index was in line with expectations (see below), it is worth noting that some imported goods, such as coffee, furniture, clothing, and appliances, climbed higher, which could be due to increased tariffs. However, favorable earnings data toward the end of last week and a better-than-expected retail sales report helped push stocks higher. For most of the week, investors weighed the White House’s push for higher tariffs on the European Union against strong corporate earnings and some favorable economic data. Among the market sectors, utilities and information technology outperformed, while health care, materials, and energy lagged. Long-term bond prices changed little, keeping yields steady. Crude oil prices slipped lower. The dollar edged higher for the second week in a row. Gold prices fell for the first time in the last three weeks.
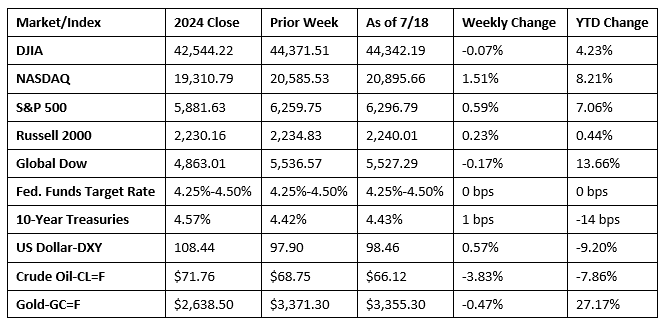
Chart reflects price changes, not total return. Because it does not include dividends or splits, it should not be used to benchmark performance of specific investments.
Last Week’s Economic News
- The Consumer Price Index increased 0.3% in June after rising 0.1% in May. The June advance was the highest monthly increase since January 2025. Over the last 12 months, the CPI increased 2.7% after rising 2.4% over the 12 months ended in May. Prices for shelter rose 0.2% in June and were the primary factors in the monthly increase. Energy prices rose 0.9% in June as gasoline prices increased 1.0% over the month. Prices for food increased 0.3%. Prices less food and energy (core prices) rose 0.2% in June following a 0.1% increase in May. Core prices rose 2.9% over the last 12 months.
- Wholesale prices were unchanged in June, according to the latest Producer Price Index from the Bureau of Labor Statistics. Producer prices rose 0.3% in May. For the 12 months ended in June, producer prices rose 2.3% after advancing 2.7% for the 12 months ended in May. Producer prices excluding food and energy were unchanged in June, as were prices excluding food, energy, and trade services. In June, a 0.3% increase in prices for goods was offset by a 0.1% decrease in prices for services. Over the last 12 months, goods prices rose 1.7%, while prices for services advanced 2.7%.
- Import prices advanced 0.1% in June following a 0.4% decrease in May. Higher prices for nonfuel imports more than offset lower prices for fuel imports in June. Prices for imports fell 0.2% from June 2024 to June 2025, matching the 12-month decline for the year ended May 2025. Those were the largest annual decreases since the index fell 0.9% for the year ended February 2024. Prices for exports increased 0.5% in June, after declining 0.6% the previous month. Export prices increased 2.8% for the year ended in June, the largest 12-month rise since the 12-month period ended January 2025.
- Retail sales rose 0.6% in June and climbed 3.9% from June 2024. Retail trade sales were up 0.6% last month, and rose 3.5% from last year. Nonstore (online) retailer sales were up 4.5% from last year, while sales at food service and drinking places were up 6.6% from June 2024.
- Industrial production (IP) beat expectations after increasing 0.3% in June. IP was unchanged in April and May. For the second quarter, IP increased at an annual rate of 1.1%. In June, manufacturing output ticked up 0.1%, and the index for mining decreased 0.3%. The index for utilities rose 2.8%. Total IP in June was 0.7% above its year-earlier level.
- The number of residential building permits issued in June was 0.2% above the May estimate but was 4.4% below the total from 12 months earlier. Issued building permits for single-family homes were 3.7% under the May figure. The number of housing starts in June was 4.6% above the May total but was 0.5% below the June 2024 rate. Single-family housing starts in June were 4.6% below the May figure. Residential housing completions in June were 14.7% below the May estimate and 24.1% under the June 2024 rate. Single-family housing completions in June were 12.5% below the May rate.
- The national average retail price for regular gasoline was $3.130 per gallon on July 14, $0.005 per gallon above the prior week’s price but $0.366 per gallon less than a year ago. Also, as of July 14, the East Coast price decreased $0.033 to $2.987 per gallon; the Midwest price rose $0.052 to $3.033 per gallon; the Gulf Coast price increased $0.053 to $2.738 per gallon; the Rocky Mountain price dipped $0.005 to $3.128 per gallon; and the West Coast price fell $0.034 to $4.041 per gallon.
- For the week ended July 12, there were 221,000 new claims for unemployment insurance, a decrease of 7,000 from the previous week’s level, which was revised up by 1,000. According to the Department of Labor, the advance rate for insured unemployment claims for the week ended July 5 was 1.3%, unchanged from the previous week’s rate. The advance number of those receiving unemployment insurance benefits during the week ended July 5 was 1,956,000, an increase of 2,000 from the previous week’s level, which was revised down by 11,000. States and territories with the highest insured unemployment rates for the week ended June 28 were New Jersey (2.5%), Rhode Island (2.5%), Puerto Rico (2.4%), Minnesota (2.2%), California (2.1%), Massachusetts (2.0%), Washington (2.0%), the District of Columbia (1.9%), Connecticut (1.8%), Oregon (1.8%), and Pennsylvania (1.8%). The largest increases in initial claims for unemployment insurance for the week ended July 5 were in Michigan (+8,854), Tennessee (+3,039), Kentucky (+2,982), New York (+2,279), and Ohio (+1,889), while the largest decreases were in New Jersey (-4,193), Nevada (-2,091), Texas (-1,163), Oregon (-1,003), and Minnesota (-984).
Eye on the Week Ahead
Most of this week’s economic data focuses on the housing sector. The June reports on existing home sales and new home sales are available this week. May saw existing home sales tick up 0.8%. Inventory of existing homes available for purchase increased in May. Higher mortgage rates continued to hinder sales. Conversely, new home sales fell more than 13.0% in May. Despite the slowdown, new home prices continued to increase in May.
The Week Ahead

The information provided is obtained from sources believed to be reliable. Forecasts cannot be guaranteed. Past performance is not a guarantee of future results.
© 2021 Broadridge Financial Solutions, Inc. All Rights Reserved.