The stock market last week had a mixed performance across major indexes, largely influenced by corporate earnings reports and ongoing discussions around trade tariffs. Both the S&P 500 and the NASDAQ reached new record highs last week, driven by strong performances from several big tech companies, which reported better-than-expected profits. In fact, last Friday’s gains marked the fifth straight record close for the S&P 500. Last week was a busy one for second-quarter earnings. Many companies exceeded expectations, while those that missed expectations saw sharp sell-offs. Tariffs remained a significant factor impacting market sentiment. While there’s some enthusiasm for trade deals, the impact of increased tariffs has impacted some market sectors. Speaking of market sectors, 10 of the 11 S&P sectors ended last week higher, with only consumer staples closing the week in the red. Treasury yields showed some movement, with the 10-year Treasury yield easing somewhat. Crude oil prices settled at $65.04, marking their lowest price since June 30 as concerns over a weakening economy brought fears of waning demand.
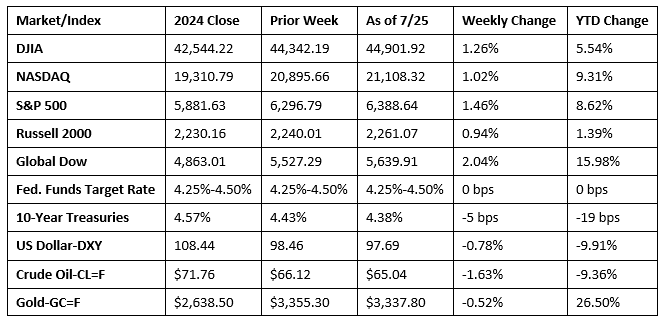
Chart reflects price changes, not total return. Because it does not include dividends or splits, it should not be used to benchmark performance of specific investments.
Last Week’s Economic News
- Existing home sales fell 2.7% in June but were unchanged from June 2024. According to the latest report from the National Association of Realtors®, record-high home prices, elevated mortgage rates, and a moderate supply are discouraging some potential home buyers, particularly first-time home purchasers. The median existing-home sale price in June was $435,300, up from the May price of $423,700, and higher than the June 2024 price of $426,900. Inventory ticked up from a 4.6-month supply in May to 4.7 months in June. Sales of single-family existing homes dipped 3.0% last month. The median single-family existing home price was $441,500 in June, compared to $428,800 in May and $432,900 in June 2024. The average 30-year fixed-rate mortgage as of July 17 was 6.75%, according to Freddie Mac, up from 6.72% one week before and down from 6.77% one year ago.
- Sales of new single-family houses in June were 0.6% above the May rate but 6.6% below the June 2024 estimate. Inventory of new single-family homes for sale sat at a 9.8-month supply at the current sales pace, which was 1.0% above the May estimate and 16.7% higher than the inventory for June 2024. The median sales price of new houses sold in June was $401,800. This was 4.9% below the May price of $422,700 and 2.9% below the June 2024 price of $414,000. The average sales price of new houses sold in June was $501,000, 2.0% under the May price of $511,500 but 1.1% above the June 2024 price of $495,500.
- New orders for manufactured durable goods in June, down two of the last three months, decreased $32.1 billion, or 9.3%. Excluding transportation, new orders increased 0.2%. Excluding defense, new orders decreased 9.4%. Transportation equipment was a major contributor to the overall decrease, falling $32.6 billion, or 22.4%. New orders for nondefense capital goods in June decreased $31.4 billion, or 24.0%. New orders for defense capital goods in June decreased $2.0 billion, or 10.2%.
- The national average retail price for regular gasoline was $3.121 per gallon on July 21, $0.009 per gallon below the prior week’s price, and $0.350 per gallon less than a year ago. Also, as of July 21, the East Coast price increased $0.019 to $3.006 per gallon; the Midwest price fell $0.047 to $2.986 per gallon; the Gulf Coast price ticked up $0.001 to $2.739 per gallon; the Rocky Mountain price increased $0.009 to $3.137 per gallon; and the West Coast price fell $0.019 to $4.022 per gallon.
- For the week ended July 19, there were 217,000 new claims for unemployment insurance, a decrease of 4,000 from the previous week’s level. According to the Department of Labor, the advance rate for insured unemployment claims for the week ended July 12 was 1.3%, unchanged from the previous week’s rate. The advance number of those receiving unemployment insurance benefits during the week ended July 12 was 1,955,000, an increase of 4,000 from the previous week’s level, which was revised down by 5,000. States and territories with the highest insured unemployment rates for the week ended July 5 were New Jersey (2.8%), Rhode Island (2.7%), Puerto Rico (2.6%), Minnesota (2.4%), California (2.2%), Massachusetts (2.1%), Washington (2.1%), the District of Columbia (2.0%), Oregon (1.9%), and Pennsylvania (1.9%). The largest increases in initial claims for unemployment insurance for the week ended July 12 were in New York (+10,001), Nevada (+4,397), Texas (+2,984), Georgia (+2,793), and Pennsylvania (+1,942), while the largest decreases were in Michigan (-4,867), New Jersey (-3,206), Tennessee (-2,574), Kentucky (-1,579), and Iowa (-1,385).
Eye on the Week Ahead
Two very important market-moving reports are out this week. The first estimate of gross domestic product for the second quarter is released this week. The economy contracted 0.5% in the first quarter. The Federal Open Market Committee meets this week. It is possible that the FOMC may decide to reduce the federal funds rate at this time, although there appears to be some disagreement among Committee members as to the timing of an interest rate reduction.
The Week Ahead

The information provided is obtained from sources believed to be reliable. Forecasts cannot be guaranteed. Past performance is not a guarantee of future results.
© 2021 Broadridge Financial Solutions, Inc. All Rights Reserved.