The U.S. stock market endured a significant downturn last week, largely due to unexpectedly weak hiring data (see below) and the imposition of new tariffs by President Trump. After reaching record highs for six straight sessions in the prior week, the S&P 500 ended last week in the red, with last Friday marking the worst single-day performance since May. The remaining benchmark indexes listed here also closed last week lower. Investors moved from risk on the heels of an underwhelming jobs report for July, which led to concerns of slowing economic growth, while new tariffs on imports from several U.S. trading partners heightened fears of accelerating inflation. Weak hiring numbers also increased expectations for a Federal Reserve interest rate cut in September. This sent Treasury yields sharply lower, with 10-year Treasury yields hitting their lowest rates since the end of April. Crude oil prices ended last week higher, although reports that OPEC+ may agree to increase production could drag prices lower.
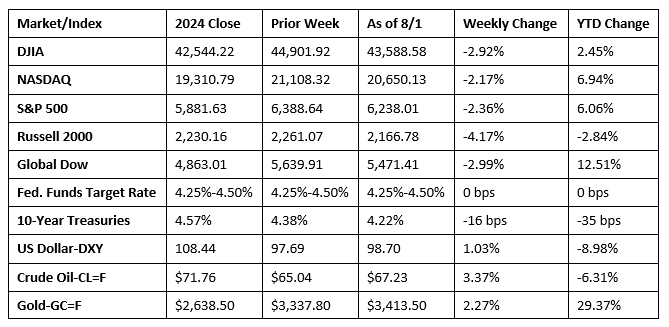
Chart reflects price changes, not total return. Because it does not include dividends or splits, it should not be used to benchmark performance of specific investments.
Last Week’s Economic News
- By a 9-2 tally, with one member absent, the Federal Open Market Committee voted to maintain interest rates at their current 4.25%-4.50% range. In making its decision, the Committee noted that growth of economic activity moderated in the first half of the year, while swings in net exports continued to affect data. However, the unemployment rate remained low, and labor market conditions were solid, although inflation was somewhat elevated. In considering the extent and timing of additional adjustments to the target range for the federal funds rate, the Committee indicated that it would carefully assess incoming data, the evolving outlook, and the balance of risks. Nevertheless, the Committee observed that uncertainty about the economic outlook remained elevated.
- Job growth in July came in well below expectations, with the addition of only 73,000 new jobs. July’s total follows larger-than-normal downward revisions in May and June, which combined, were 258,000 lower than previously reported. The unemployment rate ticked up 0.1 percentage point to 4.2%. Both the labor force participation rate and the employment-population ratio dipped 0.1 percentage point to 62.2% and 59.6%, respectively. The number of unemployed, at 7.2 million, rose by 221,000 last month. In July, the number of long-term unemployed (those jobless for 27 weeks or more) increased by 179,000 to 1.8 million, accounting for 24.9% of all unemployed people. Average hourly earnings rose by $0.12, or 0.3%, to $36.44 in July. Over the past 12 months, average hourly earnings have increased by 3.9%. The average workweek edged up by 0.1 hour to 34.3 hours in July.
- The economy expanded at an annualized rate of 3.0%, according to the initial estimate of second-quarter gross domestic product (GDP). In the first quarter, GDP decreased 0.5%. The increase in real GDP in the second quarter primarily reflected a decrease in imports (-30.3%), which are a subtraction in the calculation of GDP, and an increase in consumer spending (1.4%). These movements were partly offset by decreases in private domestic investment (-15.6%) and exports (-1.8%).
- According to the latest report from the Bureau of Economic Analysis, consumer spending increased 0.3% in June. Prices consumers paid for goods and services advanced 0.3% last month. Prices excluding food and energy (core prices) also increased 0.3%. Both personal income and disposable (after-tax) personal income each advanced 0.3% in June.
- The international trade in goods deficit was $86.0 billion in June, down $10.4 billion, or 10.8%, from the May estimate. Exports of goods for June were $178.2 billion, $1.1 billion, or 0.6%, less than May exports. Imports of goods for June were $264.2 billion, $11.5 billion, or 4.2%, less than May imports. Since June 2024, exports have risen 3.6%, while imports declined 2.5%.
- According to the latest Job Openings and Labor Turnover Summary, there were 7.4 million job openings in June, down from 7.7 million in May. The number of hires in June, at 5.2 million, fell from the May estimate of 5.5 million. Total separations in June were 5.1 million compared to 5.2 million in May. The number of job openings for May was revised down by 57,000 to 7.7 million, the number of hires was revised down by 38,000 to 5.5 million, and the number of total separations was revised down by 29,000 to 5.2 million.
- Operating conditions in the manufacturing sector worsened slightly in July as demand stagnated and tariff uncertainty continued to dominate. International sales fell and uncertainty over federal government policies weighed on sentiment, which led to a decline in employment. On the price front, input costs continued to rise steeply, again linked to tariffs, as selling prices continued to increase markedly, rising to the second-highest level since November 2022. The S&P Global US Manufacturing Purchasing Managers’ Index™ recorded 49.8 in July. That was down noticeably from June’s 52.9 following six successive months of growth, while representing the first overall deterioration of operating conditions in 2025.
- The national average retail price for regular gasoline was $3.123 per gallon on July 28, $0.002 per gallon above the prior week’s price but $0.361 per gallon less than a year ago. Also, as of July 28, the East Coast price decreased $0.007 to $2.999 per gallon; the Midwest price rose $0.028 to $3.014 per gallon; the Gulf Coast price ticked up $0.009 to $2.748 per gallon; the Rocky Mountain price declined $0.016 to $3.121 per gallon; and the West Coast price fell $0.027 to $3.995 per gallon.
- For the week ended July 26, there were 218,000 new claims for unemployment insurance, an increase of 1,000 from the previous week’s level. According to the Department of Labor, the advance rate for insured unemployment claims for the week ended July 19 was 1.3%, unchanged from the previous week’s rate. The advance number of those receiving unemployment insurance benefits during the week ended July 19 was 1,946,000, unchanged from the previous week’s level. States and territories with the highest insured unemployment rates for the week ended July 12 were New Jersey (2.8%), Puerto Rico (2.7%), Rhode Island (2.6%), Minnesota (2.2%), California (2.1%), the District of Columbia (2.1%), Massachusetts (2.1%), Washington (2.1%), Oregon (1.9%), and Pennsylvania (1.9%). The largest increases in initial claims for unemployment insurance for the week ended July 19 were in Kentucky (+4,895), Texas (+424), Iowa (+298), Indiana (+5), and Vermont (+1), while the largest decreases were in New York (-12,505), California (-4,618), Michigan (-4,116), Pennsylvania (-3,350), and New Jersey (-2,655).
Eye on the Week Ahead
This is a slow week for economic reports. Investors, instead, will look toward next week when the latest inflation data is released.
The Week Ahead

The information provided is obtained from sources believed to be reliable. Forecasts cannot be guaranteed. Past performance is not a guarantee of future results.
© 2021 Broadridge Financial Solutions, Inc. All Rights Reserved.