Wall Street experienced a mixed and volatile week, ultimately closing last Friday on a down note. Each of the benchmark indexes listed here pulled back from recent record highs. A slump in technology stocks was the primary drag on the market. The latest inflation data (see below), which showed core prices continued to rise, weighed on market sentiment, although it probably wasn’t enough to derail expectations for a September interest rate cut. Initial and continuing jobless claims were higher than predicted, evidencing continued sluggishness in the labor market. Bond yields declined as prices rose with increased demand. Crude oil prices ticked higher by week’s end, mostly driven by ongoing geopolitical factors, particularly relating to the prospects of a ceasefire in Ukraine.
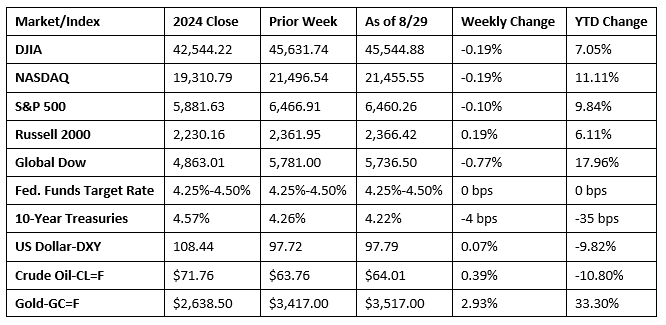
Chart reflects price changes, not total return. Because it does not include dividends or splits, it should not be used to benchmark performance of specific investments.
Last Week’s Economic News
- Gross domestic product (GDP) increased at an annual rate of 3.3% in the second quarter of 2025, according to the second estimate from the Bureau of Economic Analysis. In the first quarter, GDP decreased 0.5%. The increase in GDP in the second quarter primarily reflected a decrease in imports, which are a subtraction in the calculation of GDP, and an increase in consumer spending. These movements were partly offset by decreases in investment and exports. Personal consumption expenditures, a measure of consumer spending, rose 1.6% in the second quarter, driven by a 2.4% rise in spending on goods. Gross domestic investment fell 13.8% in the second quarter. Exports decreased 1.3%, while imports fell 29.8%.
- Personal income and disposable (after-tax) personal income each advanced 0.4% in July. Personal consumption expenditures increased 0.5%. Consumer prices rose 0.2% last month. Prices less food and energy (core prices) increased 0.3%. For the last 12 months, consumer prices have risen 2.6%, while core prices increased 2.9%.
- The advance report on international trade in goods revealed that the trade deficit rose 22.1% in July over June. While exports dipped 0.1%, imports rose 7.1%. Over the last 12 months, exports rose 3.0%, while imports climbed 1.7%.
- Sales of new single-family houses in July declined 0.6% in July and were 8.2% below the July 2024 estimate. Inventory represented a supply of 9.2 months at the current sales pace, virtually unchanged from the June 2025 estimate but above the July 2024 pace of 7.9 months. The median sales price of new houses sold in July 2025 was $403,800. This was 0.8% below the June 2025 price of $407,200 and was 5.9% less than the July 2024 price of $429,000. The average sales price of new houses sold in July 2025 was $487,300. This was 3.6% under the June 2025 price of $505,300 and was 5.0% below the July 2024 price of $513,200.
- New orders for manufactured durable goods in July, down three of the last four months, decreased $8.8 billion, or 2.8%. This followed a 9.4% decrease in June. Excluding transportation, new orders increased 1.1%. Excluding defense, new orders decreased 2.5%. Transportation equipment, also down three of the last four months, drove the July decrease, declining $10.9 billion, or 9.7%.
- The national average retail price for regular gasoline was $3.147 per gallon on August 25, $0.022 per gallon above the prior week’s price but $0.166 per gallon less than a year ago. Also, as of August 25, the East Coast price decreased $0.010 to $2.987 per gallon; the Midwest price increased $0.083 to $3.077 per gallon; the Gulf Coast price decreased $0.051 to $2.694 per gallon; the Rocky Mountain price declined $0.006 to $3.158 per gallon; and the West Coast price rose $0.062 to $4.106 per gallon.
- For the week ended August 23, there were 229,000 new claims for unemployment insurance, a decrease of 5,000 from the previous week’s level. According to the Department of Labor, the advance rate for insured unemployment claims for the week ended August 16 was 1.3%, unchanged from the previous week’s rate. The advance number of those receiving unemployment insurance benefits during the week ended August 16 was 1,954,000, a decrease of 7,000 from the previous week’s level, which was revised down by 11,000. States and territories with the highest insured unemployment rates for the week ended August 9 were New Jersey (2.7%), Rhode Island (2.6%), Massachusetts (2.2%), Minnesota (2.2%), California (2.1%), Washington (2.1%), the District of Columbia (2.0%), Puerto Rico (2.0%), Connecticut (1.9%), Oregon (1.9%), and Pennsylvania (1.9%). The largest increases in initial claims for unemployment insurance for the week ended August 16 were in Kentucky (+2,951), Iowa (+1,048), Virginia (+522), Ohio (+210), and South Carolina (+144), while the largest decreases were in California (-2,290), Michigan (-1,170), Texas (-1,085), New Jersey (-660), and Minnesota (-587).
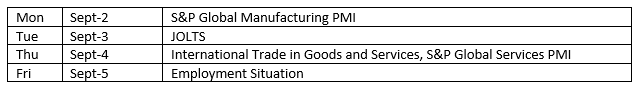
Eye on the Week Ahead
Much attention will be paid to the August jobs report released this Friday. July’s report resulted in significant downward revisions, which painted labor market conditions as much weaker than previously thought.
The Week Ahead
The information provided is obtained from sources believed to be reliable. Forecasts cannot be guaranteed. Past performance is not a guarantee of future results.
© 2025 Broadridge Financial Solutions, Inc. All Rights Reserved.