Wall Street experienced a mixed week highlighted by the Federal Reserve’s policy decision (see below) and a retreat from technology shares. Illustrative of the week’s volatility, the Dow and the S&P 500 reached record highs mid-week following the Fed’s latest rate cut, before retreating at the end of the week. Despite a negative close last Friday, the Dow, the Global Dow, and the Russell 2000 ended the week higher, while the NASDAQ and the S&P 500 finished the week in the red. Investors moved out of technology and AI stocks and into more cyclical shares like financials, materials, and small-cap stocks. Treasury yields, which move inversely to bond prices, were mixed for the most part, ultimately trending upward by week’s end. The Fed’s overall sentiment that the economy, particularly the labor market, should hold up in 2026 reduced the demand for long-term bonds. Ongoing expectations of a global surplus pulled crude oil prices lower again last week.
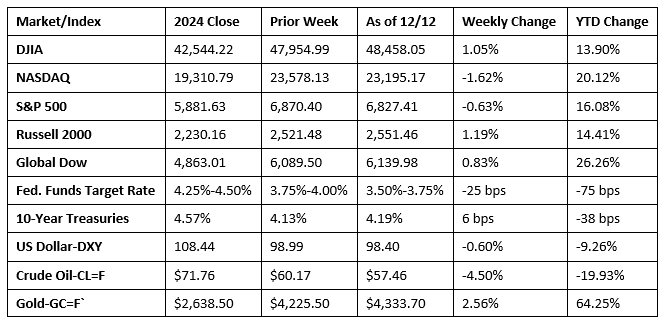
Chart reflects price changes, not total return. Because it does not include dividends or splits, it should not be used to benchmark performance of specific investments.
Last Week’s Economic News
- The Federal Reserve cut the target range for the federal funds rate by 25 basis points to 3.50%-3.75% following its December meeting. The latest reduction was in line with expectations and followed similar reductions in September and October. This most recent reduction brings the target rate range to its lowest level since 2022. The decision to reduce interest rates was not unanimous, with two members voting to maintain the current range, while a third member voted for a 50-basis-point cut. The Fed did not change its projections from September, which call for one more 25-basis-point cut in 2026. In reaching its decision, the Fed noted that job gains had slowed, while inflation moved up since earlier in the year and remained somewhat elevated.
- The Treasury deficit for November was $173 billion, $111 billion less than the October deficit. November receipts were $336 billion, while outlays totaled $509 billion. In November, individual income tax receipts ($147 billion) were the largest contributor to total monthly receipts, while Social Security payments ($134 billion) were the largest outlay. Through the first two months of the fiscal year, the total deficit sat at $458 billion, about $167 billion less than the comparable period in the previous fiscal year.
- According to the latest Job Openings and Labor Turnover Summary, the number of job openings was unchanged at 7.7 million in October from the previous month. The total number of hires slipped by 218,000 to 5.1 million. Total separations, at 5.1 million, declined 214,000 in October.
- The international trade in goods and services deficit fell 10.9% to $52.8 billion in September, according to the latest information from the Bureau of Economic Analysis. Exports rose 3.0% to $289.3 billion, while imports increased 0.6% to $342.1 billion. Year to date, the goods and services deficit increased $112.6 billion, or 17.2%, from the same period in 2024. Exports increased $125.1 billion, or 5.2%. Imports increased $237.7 billion, or 7.7%.
- For the week ended December 6, there were 236,000 new claims for unemployment insurance, an increase of 44,000 from the previous week’s level, which was revised up by 1,000. According to the Department of Labor, the advance rate for insured unemployment claims for the week ended November 29 was 1.2%, 0.1 percentage point lower than the previous week’s rate. The advance number of those receiving unemployment insurance benefits during the week ended November 29 was 1,838,000, a decrease of 99,000 from the previous week’s level, which was revised down by 2,000. States and territories with the highest insured unemployment rates for the week ended November 22 were New Jersey (2.2%), Washington (2.2%), Massachusetts (1.9%), Alaska (1.8%), Connecticut (1.8%), Nevada (1.8%), Puerto Rico (1.8%), Rhode Island (1.8%), California (1.7%), and Oregon (1.7%). The largest increases in initial claims for unemployment insurance for the week ended November 29 were in Pennsylvania (+2,208), Wisconsin (+1,092), Nebraska (+870), Iowa (+605), and Ohio (+493), while the largest decreases were in California (-19,844), Texas (-7,836), New York (-3,453), Illinois (-2,216), and Florida (-2,185).
- The national average retail price for regular gasoline was $2.985 per gallon on December 1, $0.076 per gallon below the prior week’s price and $0.049 per gallon less than a year ago. Also, as of December 1, the East Coast price decreased $0.054 to $2.931 per gallon; the Midwest price fell $0.118 to $2.740 per gallon; the Gulf Coast price dropped $0.092 to $2.551 per gallon; the Rocky Mountain price declined $0.089 to $2.783 per gallon; and the West Coast price fell $0.039 to $4.031 per gallon.
Eye on the Week Ahead
There’s plenty of important economic data released this week as various government agencies try to catch up following the reopening of the Federal government. Of particular interest this week is the latest jobs report and the release of the Consumer Price Index.
The Week Ahead

The information provided is obtained from sources believed to be reliable. Forecasts cannot be guaranteed. Past performance is not a guarantee of future results.
© 2025 Broadridge Financial Solutions, Inc. All Rights Reserved.