The stock market declined for most of last week, only to rally last Thursday and Friday. The last two weeks have been “catch-up” periods for the economy with the release of a large influx of economic data following the 43-day government shutdown. While last week started with heavy selling, particularly in the tech sector, a cooler-than-expected Consumer Price Index (see below) last Thursday helped drive the market higher. The S&P 500 and the NASDAQ ended the week higher, while the Dow, the Global Dow, and the small caps of the Russell 2000 closed down. Of the 11 S&P 500 market sectors, only consumer discretionary and health care outperformed. The remaining sectors closed the week in the red, with energy falling nearly 4.0%. Crude oil declined for a second straight week with prices falling to their lowest levels in nearly five years, as concerns over a global supply glut and trade tensions outweighed geopolitical risks. Despite unemployment rising (see below), evidence of waning inflationary pressures is leading some analysts to suggest a “Santa Claus” rally (historically occurring over the last five days of December) is in the offing.
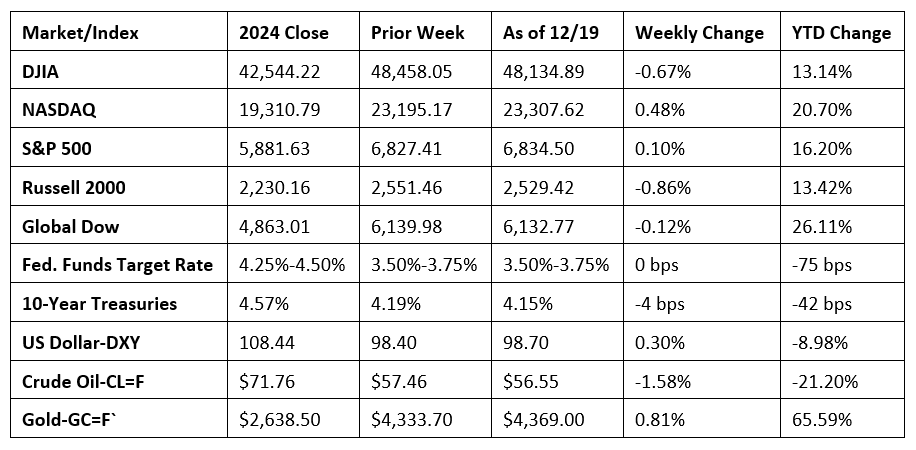
Chart reflects price changes, not total return. Because it does not include dividends or splits, it should not be used to benchmark performance of specific investments.
Last Week’s Economic News
- The latest jobs report showed that the labor market grew by 64,000 in November, in line with most expectations. The change in total employment for August was revised down by 22,000, and the change for September was revised down by 11,000. With these revisions, employment in August and September combined was 33,000 lower than previously reported. The unemployment rate in November, at 4.6%, was 0.2 percentage point above the September rate and 0.4 percentage point above the November 2024 estimate of 4.2%. The total number of unemployed, at 7.8 million, was 700,000 above the estimate from a year earlier. The labor force participation rate was 62.5% last month, while the employment-population ratio was 59.6%. Each of these measures has shown little change over the year. The number of long-term unemployed (those jobless for 27 weeks or more) changed little at 1.9 million in November and accounted for 24.3% of all unemployed people. In November, average hourly earnings edged up by $0.05, or 0.1%, to $36.86 from September. Over the past 12 months, average hourly earnings have increased by 3.5%. The average workweek increased 0.1 hour to 34.3 hours in November.
- The Consumer Price Index (CPI) increased 0.2% over the two months from September 2025 to November 2025. The CPI less food and energy also rose 0.2% over the same two months. From September to November, shelter prices increased 0.2%, energy prices rose 1.1%, and food prices increased 0.1%. Other indexes that increased over the two months ended in November include household furnishings and operations, communication, and personal care. In contrast, the indexes for lodging away from home, recreation, and apparel decreased over the same two-month period. Over the last 12 months, the CPI increased 2.7% after rising 3.0% over the 12 months ended in September. Prices less food and energy rose 2.6% over the last 12 months. Energy prices increased 4.2% for the 12 months ended in November. Prices for food increased 2.6% over the last year. The Bureau of Labor Statistics did not collect survey data for October 2025 due to a lapse in appropriations.
- Advance estimates of U.S. retail and food services sales for October 2025 were $732.6 billion, virtually unchanged from the previous month but up 3.5% from October 2024. Retail trade sales were up 0.1% from September 2025 and 3.4% from last year. Nonstore (online) retailer sales were up 9.0% from last year, while sales at food service and drinking places were up 4.1% from October 2024.
- Existing home sales rose 0.5% in November, according to the National Association of REALTORS®. However, sales dipped 1.0% from a year earlier. Existing home inventory sat at a 4.2-month supply, down from 4.4 months in October but up from 3.8 months in November 2024. The median existing-home price was $409,200 in November, 0.8% under the October price of $412,900 but up 1.2% from the price one year ago ($404,400), which was the 29th consecutive month of year-over-year price increases. Sales of existing single-family homes increased 0.8% in November but were down 0.8% from the total a year earlier. Inventory of existing single-family homes dipped from a supply of 4.3 months in October to 4.0 months in November. The median existing single-family home price was $414,300 in November, down 1.4% from the October estimate of $420,200 but 1.3% higher than the November 2024 price of $409,200.
- For the week ended December 13, there were 224,000 new claims for unemployment insurance, a decrease of 13,000 from the previous week’s level, which was revised up by 1,000. According to the Department of Labor, the advance rate for insured unemployment claims for the week ended December 6 was 1.2%, unchanged from the previous week’s rate. The advance number of those receiving unemployment insurance benefits during the week ended December 6 was 1,897,000, an increase of 67,000 from the previous week’s level, which was revised down by 8,000. States and territories with the highest insured unemployment rates for the week ended November 29 were Washington (2.5%), New Jersey (2.4%), California (2.3%), Minnesota (2.2%), Massachusetts (2.1%), Puerto Rico (2.0%), Rhode Island (2.0%), Alaska (1.9%), Oregon (1.9%), Nevada (1.8%), and New York (1.8%). The largest increases in initial claims for unemployment insurance for the week ended December 6 were in California (+14,258), Illinois (+11,074), New York (+10,346), Texas (+8,206), and Georgia (+6,333), while the largest decreases were in Rhode Island (-82), Nebraska (-65), Vermont (-16), and Delaware (-3).
- The national average retail price for regular gasoline was $2.895 per gallon on December 15, $0.045 per gallon below the prior week’s price and $0.121 per gallon less than a year ago. Also, as of December 15, the East Coast price decreased $0.050 to $2.842 per gallon; the Midwest price fell $0.030 to $2.690 per gallon; the Gulf Coast price dropped $0.001 to $2.492 per gallon; the Rocky Mountain price declined $0.097 to $2.547 per gallon; and the West Coast price fell $0.105 to $3.851 per gallon.
Eye on the Week Ahead
Tuesday is a busy day for economic data, headlined by the release of the preliminary estimate of gross domestic product for the third quarter. The Bureau of Economic Analysis is releasing two estimates of third-quarter GDP (the preliminary and final versions) instead of the customary three iterations over three consecutive months. The advance estimate, initially scheduled for an October release, was not provided due to the government shutdown.
The Week Ahead

The information provided is obtained from sources believed to be reliable. Forecasts cannot be guaranteed. Past performance is not a guarantee of future results.
© 2025 Broadridge Financial Solutions, Inc. All Rights Reserved.