The U.S. stock market endured quite a bit of volatility last week. A rally last Thursday wasn’t enough to prevent the three major market indexes, the Dow, the S&P 500, and the NASDAQ, from closing in the red. The Global Dow and the small caps of the Russell 2000 posted modest gains by last week’s end. After starting the week with mixed to higher returns, results turned choppy mid-week before Thursday’s rebound. Friday saw stocks tick lower. Consumer staples, industrials, and real estate led the market sectors, while financials underperformed. Last week marked the start of fourth-quarter earnings season, which delivered mixed results from some major banks, although the semiconductor sector provided a major boost. Investors had to decipher plenty of economic news and data, including a pending tariff ruling by the Supreme Court, domestic and international upheaval, the Justice Department’s investigation of Federal Reserve Chair Jerome Powell, and inflation data that was unchanged on its face, but showed rising shelter prices, food costs, and energy prices. Crude oil prices rose for the second straight week, influenced by lingering geopolitical risks versus easing fears of an immediate U.S. strike on Iran.
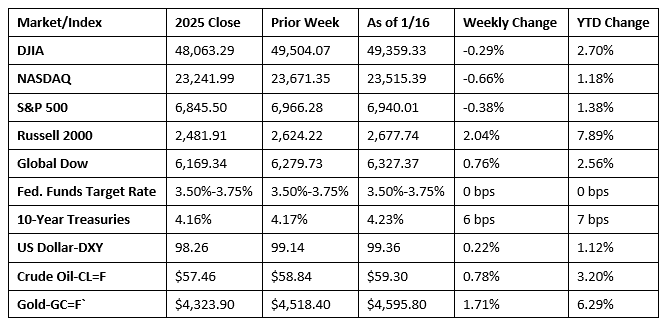
Chart reflects price changes, not total return. Because it does not include dividends or splits, it should not be used to benchmark performance of specific investments.
Last Week’s Economic News
- The Consumer Price Index advanced 0.3% in December and 2.7% for the year, which was the same increase as seen over the 12 months ended in November. The largest factor in the December increase was a 0.4% rise in shelter prices. Food prices increased 0.7% over the month, while energy prices rose 0.3% in December. Prices less food and energy rose 0.2% in December. Over the last 12 months, prices for energy increased 2.3%, while food prices increased 3.1%.
- The Producer Price Index increased 0.2% in November and 3.0% over the last 12 months. The November rise in prices was largely attributable to a 0.9% increase in prices for goods. Prices for services were unchanged from October. Producer prices less foods, energy, and trade services advanced 0.2% in November after moving up 0.7% in October. For the 12 months ended in November, prices less foods, energy, and trade services climbed 3.5%, the largest 12-month increase since March.
- According to the latest data from the Census Bureau, retail and food services sales for November 2025 were up 0.6% from the previous month and 3.3% from November 2024. Retail trade sales were up 0.6% from October 2025 and 3.1% from last year. Nonstore (online) retailer sales were up 7.2% from last year, while sales at food service and drinking places were up 4.9% from November 2024.
- Industrial Production (IP) increased 0.4% in December and grew 2.0% for the year. Manufacturing output rose 0.2% in December and 2.0% for 2025. In December, the index for mining fell 0.7% (+1.7% for the year), while the index for utilities climbed 2.6% (+2.3% for 2025).
- U.S. import prices increased 0.4% over the two months from September 2025 to November 2025. Prices for exports increased 0.5% over the same two-month period. The Bureau of Labor Statistics did not collect survey data for October 2025 due to the government shutdown. Since November 2024, import prices ticked up 0.1%, while export prices rose 3.3%.
- Sales of new single-family houses in October 2025 were 0.1% below the September rate but 18.7% above the October 2024 estimate. Inventory of new single-family homes for sale in October represented a supply of 7.9 months at the current sales rate, virtually unchanged from the September estimate but 15.1% below the estimate from a year earlier. The median sales price of new houses sold in October 2025 was $392,300. This was 3.3% below the September 2025 price of $405,800 and 8.0% below the October 2024 price of $426,300. The average sales price of new houses sold in October 2025 was $498,000. This was 3.0% above the September 2025 price of $483,500 but was 4.6% below the October 2024 price of $521,900.
- Existing home sales rose 5.1% in December and 1.4% over the last 12 months. Inventory of existing homes for sale declined 21.4% to a 3.3-month supply in December but was in line with the estimate from December 2024. The median sales price was $405,400 last month, down from $410,000 in November but higher than the December 2024 estimate of $403,700. Sales of existing single-family homes also rose 5.1% in December, 1.8% over the last 12 months. The median sales price for existing single-family homes in December was $409,500, down from the November price of $415,100, and marginally higher than the December 2024 price of $408,500.
- According to the latest data from the Department of the Treasury, the government deficit was $145 billion in December, less than the November deficit of $173 billion but well above the December 2024 deficit of $87 billion. In December, receipts totaled $484 billion, while expenditures were $629 billion. Over the first three months of the current fiscal year, the government deficit sits at $602 billion, 15.0% less than the cumulative deficit over the same period of the previous fiscal year. So far in this fiscal year, individual income taxes, at $606 billion, account for nearly half of the total receipts of $1,225 billion. Total expenditures for this fiscal year equal $1,827 billion, of which Social Security ($402 billion) and National Defense ($267 billion) account for the largest outlays.
- For the week ended January 10, there were 198,000 new claims for unemployment insurance, a decrease of 9,000 from the previous week’s level, which was revised down by 1,000. According to the Department of Labor, the advance rate for insured unemployment claims for the week ended January 3 was 1.2%, unchanged from the previous week’s rate. The advance number of those receiving unemployment insurance benefits during the week ended January 3 was 1,884,000, a decrease of 19,000 from the previous week’s level, which was revised down by 11,000. States and territories with the highest insured unemployment rates for the week ended December 27 were New Jersey (2.9%), Rhode Island (2.9%), Washington (2.8%), Minnesota (2.7%), Massachusetts (2.6%), Oregon (2.3%), Illinois (2.2%), Montana (2.2%), Alaska (2.1%), California (2.1%), Connecticut (2.1%), and New York (2.1%). The largest increases in initial claims for unemployment insurance for the week ended January 3 were in New York (+15,317), Georgia (+5,705), Texas (+5,323), California (+4,300), and Oregon (+2,737), while the largest decreases were in New Jersey (-4,684), Missouri (-3,235), Illinois (-2,971), Connecticut (-2,136), and Ohio (-2,011).
- The national average retail price for regular gasoline was $2.779 per gallon on January 12, $0.017 per gallon below the prior week’s price and $0.264 per gallon less than a year ago. Also, as of January 12, the East Coast price decreased $0.037 to $2.741 per gallon; the Midwest price ticked up $0.019 to $2.604 per gallon; the Gulf Coast price inched up $0.003 to $2.375 per gallon; the Rocky Mountain price rose $0.019 to $2.422 per gallon; and the West Coast price fell $0.059 to $3.649 per gallon.
Eye on the Week Ahead
The final estimate of gross domestic product for the third quarter of 2025 is scheduled for release this week. The prior estimate showed the economy expanded at an annualized rate of 4.3% in the third quarter.
The Week Ahead

The information provided is obtained from sources believed to be reliable. Forecasts cannot be guaranteed. Past performance is not a guarantee of future results.
Data sources: Economic: Based on data from U.S. Bureau of Labor Statistics (unemployment, inflation); U.S. Department of Commerce (GDP, corporate profits, retail sales, housing); S&P/Case-Shiller 20-City Composite Index (home prices); Institute for Supply Management (manufacturing/services). Performance: Based on data reported in WSJ Market Data Center (indexes); U.S. Treasury (Treasury yields); U.S. Energy Information Administration/Bloomberg.com Market Data (oil spot price, WTI, Cushing, OK); www.goldprice.org (spot gold/silver); Oanda/FX Street (currency exchange rates).
© 2026 Broadridge Financial Solutions, Inc. All Rights Reserved.