Stocks ended last week sharply lower, impacted by renewed inflation and geopolitical events. Each of the benchmark indexes listed here ended the week lower, while crude oil prices surged to the highest levels since August 2022, as intensifying tensions in the Middle East disrupted global energy trade. Higher energy costs triggered a move from risk, with industrials, consumer staples, and materials being hit the hardest. Surging oil prices also spiked inflation fears, while the labor sector continued to lag (see below). With last week’s decline, the Dow, the S&P 500, and the NASDAQ each retreated to year-to-date lows.
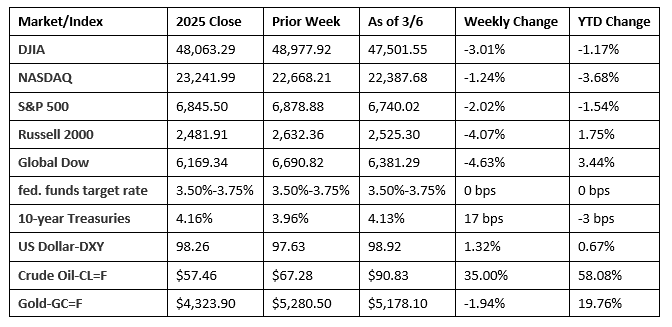
Chart reflects price changes, not total return. Because it does not include dividends or splits, it should not be used to benchmark performance of specific investments.
Last Week’s Economic News
- The jobs sector continued to lag in February. According to the latest report from the Bureau of Labor Statistics, employment edged down by 92,000 last month, while the unemployment rate ticked up 0.1 percentage point to 4.4%. The number of unemployed people, at 7.6 million, rose by 203,000. The number of long-term unemployed (those jobless for 27 weeks or more) changed little at 1.9 million in February but was up from 1.5 million a year earlier. The long-term unemployed accounted for 25.3% of all unemployed people in February. Both the labor force participation rate and the employment-population ratio dipped 0.1 percentage point to 62.0% and 59.3%, respectively. The change in employment for December was revised down by 65,000, from +48,000 to -17,000, and the change for January was revised down by 4,000, from +130,000 to +126,000. With these revisions, employment in December and January combined was 69,000 lower than previously reported. In February, average hourly earnings rose by $0.15, or 0.4%, to $37.32. Over the past 12 months, average hourly earnings have increased by 3.8%. Last month, the average workweek was unchanged at 34.3 hours.
- The U.S. manufacturing sector expanded in February but at the slowest pace in seven months. The S&P Global US Manufacturing Purchasing Managers’ Index™ recorded 51.6 last month, compared to 52.4 in January. February saw both output and new orders rise at slower rates, in part due to extreme weather and tariffs, which impacted trade.
- Similar to manufacturing, the services sector saw growth slow in February. The S&P Global US Services PMI® Business Activity Index decreased from 52.7 in January to 51.7 last month. Survey respondents reported that lower interest rates helped drive new business but uncertainty regarding tariffs and government policies limited the rate of demand, particularly for international business, which saw new export business decline marginally.
- Import prices increased 0.2% in January following a 0.2% advance in December. Higher prices for nonfuel imports (+0.5%) more than offset lower prices for fuel imports (-2.2%) in January. Import prices declined 0.1% from January 2025 to January 2026. Prices for exports rose 0.6% in January after rising 0.6% the previous month. Export prices advanced 2.6% over the 12-month period ended in January.
- Sales at the wholesale level slid 0.2% in January from the previous month. However, retail sales rose 3.2% from January 2025. Retail trade sales declined 0.2% in January but were up 3.0% from a year ago. Nonstore (online) retailer sales increased 1.9% in January and 10.9% from last year, while food service and drinking places sales dipped 0.2% in January but were up 3.9% from January 2025.
- For the week ended February 28, there were 213,000 new claims for unemployment insurance, unchanged from the previous week’s level, which was revised up by 1,000. According to the Department of Labor, the advance rate for insured unemployment claims for the week ended February 21 was 1.2%, unchanged from the previous week’s rate. The advance number of those receiving unemployment insurance benefits during the week ended February 21 was 1,868,000, an increase of 46,000 from the previous week’s level, which was revised down by 11,000. States and territories with the highest insured unemployment rates for the week ended February 14 were Rhode Island (3.0%), New Jersey (2.9%), Massachusetts (2.8%), Washington (2.5%), Minnesota (2.4%), Illinois (2.2%), New York (2.2%), California (2.1%), Montana (2.1%), Oregon (2.0%), and Pennsylvania (2.0%). The largest increases in initial claims for unemployment insurance for the week ended February 21 were in Rhode Island (+1,515), Oklahoma (+351), Tennessee (+218), Hawaii (+202), and Maine (+125), while the largest decreases were in Michigan (-3,577), New York (-2,694), Ohio (-1,956), Texas (-1,184), and Kentucky (-1,012).
- The national average retail price for regular gasoline was $3.015 per gallon on March 2, $0.078 per gallon above the prior week’s price but $0.063 per gallon less than a year ago. Also, as of March 2, the East Coast price increased $0.048 to $2.882 per gallon; the Midwest price rose $0.119 to $2.794 per gallon; the Gulf Coast price increased $0.112 to $2.644 per gallon; the Rocky Mountain price ticked up $0.096 to $2.758 per gallon; and the West Coast price increased $0.049 to $4.160 per gallon.
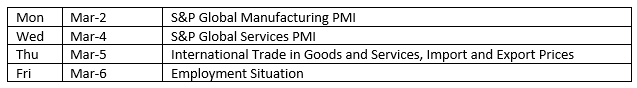
Eye on the Week Ahead
There are plenty of important economic reports out this week. The second estimate of fourth-quarter GDP is out, while the latest inflation data is available with the release of the Consumer Price Index and the personal consumption expenditures price index.
The Week Ahead
The information provided is obtained from sources believed to be reliable. Forecasts cannot be guaranteed. Past performance is not a guarantee of future results.
Data sources: Economic: Based on data from U.S. Bureau of Labor Statistics (unemployment, inflation); U.S. Department of Commerce (GDP, corporate profits, retail sales, housing); S&P/Case-Shiller 20-City Composite Index (home prices); Institute for Supply Management (manufacturing/services). Performance: Based on data reported in WSJ Market Data Center (indexes); U.S. Treasury (Treasury yields); U.S. Energy Information Administration/Bloomberg.com Market Data (oil spot price, WTI, Cushing, OK); www.goldprice.org (spot gold/silver); Oanda/FX Street (currency exchange rates).
© 2026 Broadridge Financial Solutions, Inc. All Rights Reserved.