The S&P 500 experienced its first negative week in the month of July, finishing down 1.23%. The index is still up 18.74 year-to-date. To ease concerns that stocks have moved up too much, too soon, consider this: the index at 2,976.61 is up just 1.56% from last year’s September 20th high of 2,930.75 and has little more than recovered from 2018’s fourth quarter 20% route.
Earning surprises were generally positive last week. Similar results are expected as reporting picks up this week, when ten of the Dow 30 companies report their Q2 results. We look forward to the economic insights which will be provided in the reports of companies like Visa, AT&T, Caterpillar, Alphabet, 3M, Amazon, and Intel to name just a few.
On the One Hand
- Retail sales were up 0.4% in June following a 0.4% increase in May. The year-over-year gain was 3.4%.
- Import prices declined 0.9% in June and export prices declined 0.7%. In the past year, import prices are down 2.0%, while export prices are down 1.6%.
- Initial unemployment claims were a tad higher but were still at the very low rate of 216,000. The four-week average for initial claims dipped slightly to 218,750. Continuing claims for the week declined by 42,000 to 1.686 million.
- The preliminary University of Michigan Consumer Sentiment Index for July was posted at 98.4, up slightly from the June post of 98.2.
On the Other Hand
- Industrial production was unchanged in June, below the consensus expected gain of 0.1%. Mining output rose 0.2% in June, while utilities declined 3.6%. Manufacturing, which excludes mining/utilities, rose 0.4% in June. Overall capacity utilization declined to 77.9% in June from 78.1% in May.
- Business inventories increased 0.3% in May following the 0.5% increase in April. Business sales rose 0.2% in May, making up for the 0.2% decline in April. Expanding inventories could very well be due to attempts to plan around new tariff threats. On the bright side, the gap between sales and inventory growth should help keep prices in check in the near term.
- The lag in housing continued with starts declining 0.9% in June to a 1.253 million annual rate. Building permits declined 6.1% in June to a seasonally adjusted annual rate of 1.220 million.
- The Leading Economic Index was down 0.3% in June, the first decline in the index this year. The Coincident Economic Index rose 0.1% in June following the 0.2% increase in May and the Lagging Economic Index was also higher by 0.6% following the 0.2% dip in May.
All Else Being Equal
Statements from Fed officials last week indicate a consensus expectation of muted economic growth and, more importantly, inflationary pressures in the balance of 2019 and into 2020. The only question concerning next week’s FOMC rate decision seems to be: will reduction be just 1/4 percent or a full 1/2 percent?
Supporting the reasoning for lower Fed Funds targets are the estimates of slower GDP growth. The Atlanta Fed staff’s GDPNow guess is holding at 1.6%.
Last Week’s Market

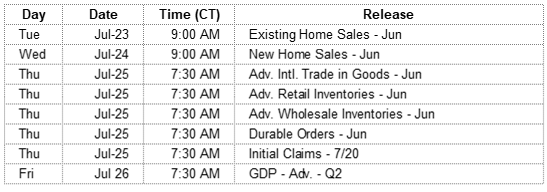
The Week Ahead

The information provided is obtained from sources believed to be reliable. Forecasts cannot be guaranteed. Past performance is not a guarantee of future results.