Wall Street marked another week of gains, with each of the benchmark indexes climbing higher. The Dow and the S&P 500 attained new records, while the NASDAQ rode a spurt in tech and communication shares. Nine of the 11 market sectors closed the week higher, led by utilities, financials, and real estate. Health care and energy declined. Gold prices also reached new record highs, driven by global demand for safer assets and expectations of further interest rate cuts by major central banks. Crude oil prices declined, marking the largest weekly drop since the beginning of September. Weaker demand and slowing economic growth in China drove the downturn in crude oil prices.
The Dow and the S&P 500 achieved fresh highs last Monday as corporate earnings season kicked into high gear. The NASDAQ climbed 0.9% behind a strong performance by tech shares. The S&P 500 rose 0.8%, the Russell 2000 added 0.6%, the Dow advanced 0.5%, and the Global Dow gained 0.4%. Crude oil prices fell 2.1% to $73.98 per barrel as OPEC+ cut the outlook for demand. The dollar rose 0.3%, while gold prices fell 0.2%. The bond market was closed for the holiday.
Last Monday’s rally didn’t carry over to Tuesday. Each of the benchmark indexes listed here closed sharply lower as weak corporate earnings from a large chipmaker led to a broad selloff in tech shares. The NASDAQ lost 1.0%, while the Dow and the S&P 500 fell 0.8%. The Global Dow dipped 0.6%. The small caps of the Russell 2000 ticked up 0.1%. Ten-year Treasury yields closed at 4.03%, a 0.6-basis-point decline. Crude oil prices dropped 4.0% to $70.90 per barrel. The dollar was flat, while gold prices rose 0.4%.
Stocks closed higher last Wednesday, with the Dow reaching another record high. The Russell 2000 gained 1.6%, followed by the Dow (0.8%), the S&P 500 (0.5%), the NASDAQ (0.3%), and the Global Dow (0.1%). Utilities and financials led the market sectors, while communication services and consumer staples declined. Yields on 10-year Treasuries slipped to 4.01%. Crude oil prices decreased for the third straight day, closing at $70.49 per barrel. The dollar and gold prices increased.
Last Thursday saw stocks close with mixed results. The Dow rose 0.4%, notching another record, the Global Dow inched up 0.1%, and the NASDAQ gained less than 0.1%. The Russell 2000 lost 0.3%, and the S&P 500 closed marginally lower. Ten-year Treasury yields climbed 0.8 basis points to 4.09%. Crude oil prices ended a downward trend, gaining 0.5% to settle at $70.76 per barrel. The dollar gained 0.2%, and gold prices rose 0.6%.
Stocks ended last Friday’s session mostly higher as the S&P 500 (0.4%) and the Dow (0.1%) recorded new highs. The tech-heavy NASDAQ gained 0.6%, and the Global Dow rose 0.4%. The Russell 2000 fell 0.2%. Positive earnings data and a surge in Megacaps helped drive the market higher. Yields on 10-year Treasuries slipped to 4.07%. Crude oil gave back the previous day’s gains after falling 1.9%. The dollar declined 0.3%, while gold prices rose 1.1%.
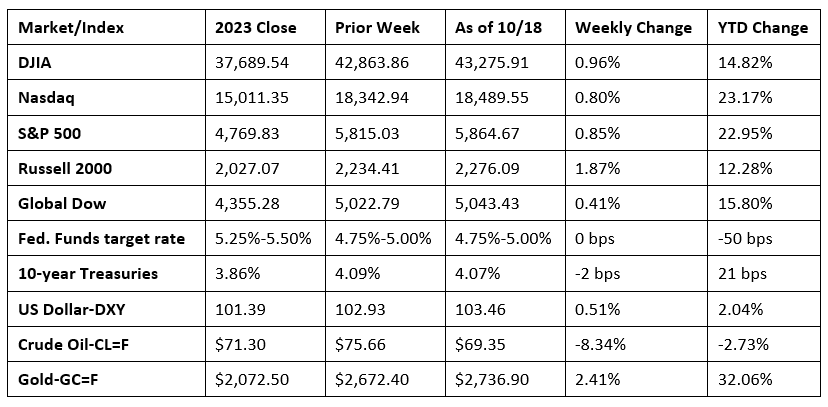
Chart reflects price changes, not total return. Because it does not include dividends or splits, it should not be used to benchmark performance of specific investments.
Last Week’s Economic News
- In September, retail and food services sales rose 0.4% from the previous month and increased 1.7% from a year earlier. Retail trade sales climbed 0.3% in September and 1.4% from last year. Nonstore (online) retail sales advanced 0.4% last month and 7.1% from September 2023. Gasoline station sales fell 1.6% in September and were down 10.7% for the year.
- Industrial production decreased 0.3% in September after advancing 0.3% in August. A strike at a major producer of civilian aircraft and the effect of two hurricanes impacted industrial production in September. Manufacturing output fell 0.4% last month, and mining dropped 0.6%. Utilities gained 0.7%. Total industrial production in September was 0.6% below its year-earlier level.
- Prices for U.S. imports declined 0.4% in September following a 0.2% decrease the previous month, according to the U.S. Bureau of Labor Statistics. Lower fuel prices in September more than offset higher nonfuel prices. U.S. export prices fell 0.7% in September, after declining 0.9% in August. Import prices edged down 0.1% over the past year, the first 12-month drop since February 2024. Export prices declined 2.1% over the past year, the largest 12-month decrease since January 2024.
- The number of issued building permits declined 2.9% in September and was 5.7% below the September 2023 rate. Single-family authorizations in September were 0.3% above the revised August figure. Privately-owned housing starts in September were 0.5% below the revised August estimate and were 0.7% below the September 2023 rate. Single-family housing starts in September were 2.7% above the revised August figure. Privately-owned housing completions in September were 5.7% below the revised August estimate but 14.6% above the September 2023 rate. Single-family housing completions in September were 2.7% below the revised August rate.
- The national average retail price for regular gasoline was $3.171 per gallon on October 14, $0.035 per gallon above the prior week’s price but $0.405 per gallon less than a year ago. Also, as of October 14, the East Coast price rose $0.033 to $3.042 per gallon; the Midwest price increased $0.064 to $3.100 per gallon; the Gulf Coast price inched up $0.010 to $2.735 per gallon; the Rocky Mountain price dipped $0.013 to $3.258 per gallon; and the West Coast price increased $0.020 to $4.047 per gallon.
- For the week ended October 12, there were 241,000 new claims for unemployment insurance, a decrease of 19,000 from the previous week’s level, which was revised up by 2,000. According to the Department of Labor, the advance rate for insured unemployment claims for the week ended October 5 was 1.2%, unchanged from the previous week’s rate. The advance number of those receiving unemployment insurance benefits during the week ended October 5 was 1,867,000, an increase of 9,000 from the previous week’s level, which was revised down by 3,000. States and territories with the highest insured unemployment rates for the week ended September 28 were New Jersey (2.2%), California (2.0%), Puerto Rico (1.8%), Rhode Island (1.8%), Washington (1.8%), Nevada (1.6%), Massachusetts (1.5%), New York (1.5%), Illinois (1.4%), Connecticut (1.3%), and Pennsylvania (1.3%). The largest increases in initial claims for unemployment insurance for the week ended October 5 were in Michigan (+9,389), North Carolina (+8,714), Ohio (+4,648), California (+4,068), and Florida (+4,021), while the largest decreases were in Wyoming (-24), Idaho (-21), Louisiana (-13), Massachusetts (-12), and Alaska (-10).
Eye on the Week Ahead
The September figures for sales of existing and new homes are available this week. Both markets saw a slip in sales in August. However, with mortgage rates slowly decreasing and inventory increasing, sales should pick up some steam throughout the remainder of the year.
The Week Ahead

The information provided is obtained from sources believed to be reliable. Forecasts cannot be guaranteed. Past performance is not a guarantee of future results.
© 2021 Broadridge Financial Solutions, Inc. All Rights Reserved.