Stocks suffered through their worst week since September, with each of the benchmark indexes listed here falling more than 2.3% with the exception of the Global Dow, which gained less than 1.0%. Investors faced trade tensions, policy uncertainty, and a slightly weaker-than-expected jobs report. Each of the market sectors declined last week, with the exception of health care. Information technology dropped more than 7.4%. Last Friday, reassurance from Fed Chair Jerome Powell that the economy remained solid helped quell some of the angst among investors, which helped push bond yields higher at week’s end. Crude oil prices rallied on Friday but not enough to prevent a weekly decline of over 4.0%.
The stock market began last week on a sour note following President Trump’s affirmation that tariffs on Canada and Mexico would take effect early last week. Stocks saw a major drop in value as investors feared the new tariffs would negatively impact the economy. The S&P 500 (-1.8%) had its worst day since December. The NASDAQ fell 2.6%, and the Dow lost 1.5%. The small caps of the Russell 2000 plunged 2.8%. The Global Dow rose 0.2%. Tech and energy shares led the sell-off. The yield on 10-year Treasuries dipped 5.1 basis points to 4.18% as investors moved toward government bonds. Crude oil prices fell 2.1% to settle at $68.36 per barrel, marking the lowest price this year. The dollar index dipped 1.0%, while gold prices rose nearly 2.0%.
Stocks continued to tumble lower last Tuesday as investors reacted to escalating trade tensions. The Global Dow and the Dow each fell 1.6%, followed by the S&P 500 (-1.2%), the Russell 2000 (-1.1%), and the NASDAQ (-0.4%). Ten-year Treasury yields settled at 4.20%. Crude oil prices declined to $68.28 per barrel. The dollar index lost 1.0% against a basket of world currencies, while gold prices rose 0.9%.
Investors moved back to equities last Wednesday after President Trump announced a one-month exemption on auto tariffs for Mexico and Canada. The Global Dow reversed the prior day’s downturn, climbing 1.8%, followed by the NASDAQ, which rose 1.5%. The Dow and the S&P 500 each advanced 1.1%, while the Russell 2000 climbed 1.0%. Ten-year Treasury yields added 5.5 basis points to reach 4.26%. Crude oil prices dropped 2.7% to $66.45 per barrel. The dollar fell 1.3%, while gold prices ticked up 0.3%.
Wall Street couldn’t maintain momentum from the previous day as stocks declined. Investors appeared anxious as uncertainty over tariffs prevailed. Tech stocks led the downturn. The NASDAQ lost 2.6% on the day and more than 10.0% from its December high, plunging that index into correction territory. The S&P 500 dropped 1.8%, the Russell 2000 declined 1.6%, and the Dow fell 1.0%. The Global Dow eked out a 0.1% gain. Yields on 10-year Treasuries ticked up to 4.28%. Crude oil prices stemmed losses, settling at about $66.28 per barrel. The dollar dipped 0.1%, and gold prices fell 0.2%.
Stocks rebounded last Friday to end a volatile week of trading. The NASDAQ led the benchmark indexes listed here after climbing 0.7%. The S&P 500 rose 0.6%, the Dow gained 0.5%, the Russell 2000 added 0.4%, and the Global Dow inched up 0.2%. Ten-year Treasury yields gained 3.1 basis points to close at 4.31%. Crude oil prices advanced 1.0%, while both the dollar and gold prices fell.
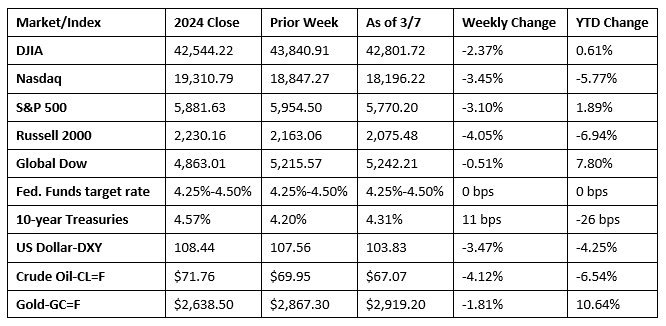
Chart reflects price changes, not total return. Because it does not include dividends or splits, it should not be used to benchmark performance of specific investments.
Last Week’s Economic News
- Employment rose by 151,000 in February, according to the latest report from the Bureau of Labor Statistics. February’s job gains were below the average over the past 12 months (168,000). In February, employment trended up in health care, financial activities, transportation and warehousing, and social assistance. Federal government employment declined. The change in employment for December was revised up by 16,000, while the change for January was revised down by 18,000. With these revisions, employment in December and January combined was 2,000 lower than previously reported. The unemployment rate ticked up 0.1 percentage point to 4.1% last month, while the number of unemployed rose by 203,000 to 7.1 million. The labor force participation rate and the employment-population ratio each declined 0.2 percentage point to 62.4% and 59.9%, respectively. The number of long-term unemployed (those jobless for 27 weeks or more), at 1.5 million, changed little in February. The long-term unemployed accounted for 20.9% of all unemployed people. In February, average hourly earnings rose by $0.10, or 0.3%, to $35.93. Over the past 12 months, average hourly earnings have increased by 4.0%. In February, the average workweek was unchanged at 34.1 hours.
- According to the latest S&P Global survey of purchasing managers, the manufacturing sector accelerated in February, which saw notable increases in production and new orders. It is likely that the rise in new orders was partially driven by advanced purchases ahead of anticipated price increases and supply disruptions due to tariff impositions. There was also evidence that some suppliers were already adjusting their prices upwards in direct response to potential tariffs, with input cost inflation increasing to its highest level since November 2022. Output charges also rose to a two-year high in February.
- The services sector continued to expand in February but at a slower pace than in prior months. The S&P Global US Services PMI® Business Activity Index recorded 51.0 in February, marking the tenth straight month of expansion but at the slowest rate of growth since November 2023. Survey respondents expressed concern over the impact of government trade policies and federal budget cuts. Job cuts were noted in the services sector for the first time in three months.
- The latest report on the international trade in goods and services deficit, released March 6, is for January and revealed that the trade deficit was $131.4 billion in January, up $33.3 billion, or 34.0%, from December. January exports were $269.8 billion, $3.3 billion, or 1.2%, more than December exports. January imports were $401.2 billion, $36.6 billion, or 10.0%, more than December imports. For the 12 months ended in January, the goods and services deficit increased $64.5 billion, or 96.5%, from January 2024. Exports increased $10.6 billion, or 4.1%. Imports increased $75.2 billion, or 23.1%.
- The national average retail price for regular gasoline was $3.078 per gallon on March 3, $0.047 per gallon below the prior week’s price and $0.272 per gallon less than a year ago. Also, as of March 3, the East Coast price fell $0.034 to $2.977 per gallon; the Midwest price decreased $0.056 to $2.882 per gallon; the Gulf Coast price declined $0.068 to $2.636 per gallon; the Rocky Mountain price decreased $0.055 to $2.964 per gallon; and the West Coast price dipped $0.047 to $4.141 per gallon.
- For the week ended March 1, there were 221,000 new claims for unemployment insurance, a decrease of 21,000 from the previous week’s level. According to the Department of Labor, the advance rate for insured unemployment claims for the week ended February 22 was 1.2%. The advance number of those receiving unemployment insurance benefits during the week ended February 22 was 1,897,000, an increase of 42,000 from the previous week’s level, which was revised down by 7,000. States and territories with the highest insured unemployment rates for the week ended February 15 were New Jersey (2.9%), Rhode Island (2.9%), Minnesota (2.6%), Massachusetts (2.4%), Montana (2.4%), Washington (2.4%), California (2.3%), Illinois (2.3%), Pennsylvania (2.0%), Connecticut (1.9%), Michigan (1.9%), and New York (1.9%). The largest increases in initial claims for unemployment insurance for the week ended February 22 were in Massachusetts (+3,808), Rhode Island (+2,081), Illinois (+1,539), Wisconsin (+1,016), and Missouri (+973), while the largest decreases were in Kentucky (-3,074), California (-2,657), Tennessee (-2,550), Washington (-2,000), and Texas (-1,177).
Eye on the Week Ahead
The latest reports on inflation are available this week with the releases of the Consumer Price Index and the Producer Price Index. The CPI was 3.0% for the year ended in January, while the PPI was up 3.5% from the year before.
The Week Ahead

The information provided is obtained from sources believed to be reliable. Forecasts cannot be guaranteed. Past performance is not a guarantee of future results.
© 2021 Broadridge Financial Solutions, Inc. All Rights Reserved.