Wall Street saw momentum ebb and flow throughout last week, with stocks ultimately closing lower for the fourth week in a row. Investors were influenced by growing uncertainty over inflation and tariffs. Despite a strong close to the week, the overall decline in equities has been notable. In less than a month, the benchmark indexes moved into correction territory at a rapid pace. Bond yields rose from 4.21% at the start of the week to 4.30% last Friday. Crude oil prices ticked higher by week’s end as geopolitical uncertainty, particularly over the Ukraine war, continued to weigh on supply and demand concerns.
The stock market sell-off ramped up last Monday as investors’ concerns intensified over tariffs and a possible recession. Megacaps, in particular, and tech shares were hit hardest. The NASDAQ fell 4.0%, marking its worst day since 2022. The S&P 500 and the Russell 2000 each lost 2.7%. The Dow declined 2.1%, while the Global Dow dropped 1.7%. Ten-year Treasury yields settled at 4.21% — the lowest rate since last December. Demand concerns dragged crude oil prices lower, falling to $65.98 per barrel. The dollar ticked up 0.1%, while gold prices fell 0.7%.
Last Tuesday saw stocks extend losses amid trade policy uncertainty. Among the benchmark indexes listed here, only the Russell 2000 was able to eke out a minimal (0.2%) gain. The Global Dow fell 1.2%, and the Dow lost 1.1%. The S&P 500 dropped 0.8%, and the NASDAQ slipped 0.2%. Yields on 10-year Treasuries rose to 4.28%. Crude oil prices climbed to $66.53 per barrel. The dollar fell 0.6%, while gold prices gained 0.9%.
Stocks rose moderately higher last Wednesday as inflation concerns eased following the release of the latest Consumer Price Index (see below). Rebounding tech shares helped drive the market overall, with the NASDAQ (1.2%) leading the benchmark indexes listed here. The S&P 500 rose 0.5%, the Global Dow added 0.3%, the Russell 2000 ticked up 0.2%, while the Dow fell 0.2%. Ten-year Treasury yields rose to 4.31%. Crude oil prices advanced for the second straight day, rising to $67.68 per barrel. The dollar index gained 0.3%, and gold prices rose 0.7%.
Wall Street couldn’t maintain the prior day’s momentum last Thursday as more tariff threats shook investor confidence. The NASDAQ gave back all of Wednesday’s gains after falling 2.0%. The Russell 2000 dropped 1.6%, the S&P 500 declined 1.4%, the Dow dipped 1.3%, and the Global Dow lost 0.7%. Ten-year Treasury yields slipped to 4.27%. Crude oil prices dropped 1.7% to $66.56 per barrel. The dollar index rose 0.3%, while gold prices jumped 1.7%.
Stocks rallied last Friday, putting an end to a tough week as concerns over a U.S. government shutdown eased. Each of the benchmark indexes listed here closed higher, led by the NASDAQ (2.6%), followed by the Russell 2000 (2.5%), the S&P 500 (2.1%), the Dow (1.7%), and the Global Dow (1.5%). Yields on 10-year Treasuries advanced, closing the session at 4.30%. Crude oil prices rose 0.9%. The dollar index slipped 0.1%. Gold prices increased 0.4%.
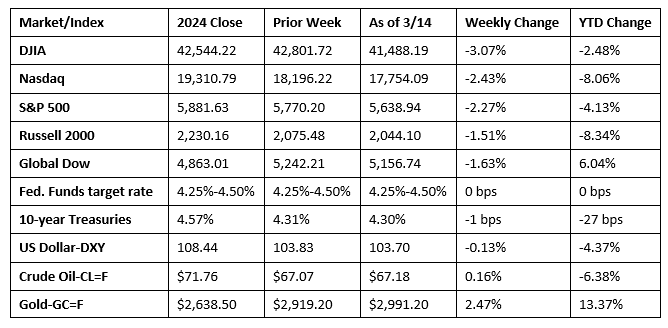
Chart reflects price changes, not total return. Because it does not include dividends or splits, it should not be used to benchmark performance of specific investments.
Last Week’s Economic News
- Consumer prices growth slowed in February. According to the latest information from the Bureau of Labor Statistics, the Consumer Price Index ticked up 0.2% in February after climbing 0.5% in January. Over the last 12 months ended in February, the CPI rose 2.8% following a 3.0% increase for the year ended in January. The CPI less food and energy rose 0.2% in February, following a 0.4% increase in January. The CPI less food and energy index rose 3.1% over the last 12 months. Energy prices decreased 0.2% for the 12 months ended February. Food prices increased 2.6% over the last year. Gasoline prices declined 1.0% in February and 3.1% since February 2024.
- The Producer Price Index was unchanged in February after advancing 0.6% in January. For the 12 months ended in February, the PPI rose 3.2%. In February, a 0.3% increase in prices for goods offset a 0.2% decline in prices for services. The PPI less foods, energy, and trade services moved up 0.2% in February after rising 0.3% in January. For the 12 months ended in February, prices less foods, energy, and trade services advanced 3.3%.
- The number of job openings rose by 232,000 to 7.7 million in January, according to the latest Job Openings and Labor Turnover Summary. The number of hires in January, at 5.4 million, changed little from the prior month. The number of total separations, which include quits, layoffs, and discharges, rose by about 170,000 to 5.3 million in January. In 2024, the annual average job openings level was 7.8 million, a decrease of 1.5 million from 2023. In 2024, the annual hires level was 65.3 million, a decrease of 5.1 million from 2023. Annual total separations decreased by 4.6 million in 2024 to 63.2 million.
- The government deficit for February was $307 billion, well above the January deficit of $129 billion and slightly over the February 2024 deficit of $296 billion. Through the first five months of the fiscal year, the deficit sits at $1.147 trillion, over 38% higher than the deficit over the same period last fiscal year. So far this year, government receipts, at $1.893 trillion, are marginally above the figure from last fiscal year. Government expenditures, totaling $3.039 trillion, are over 13% higher than expenditures over the same period last year.
- The national average retail price for regular gasoline was $3.069 per gallon on March 10, $0.009 per gallon below the prior week’s price and $0.307 per gallon less than a year ago. Also, as of March 10, the East Coast price fell $0.032 to $2.945 per gallon; the Midwest price increased $0.017 to $2.899 per gallon; the Gulf Coast price rose $0.044 to $2.680 per gallon; the Rocky Mountain price decreased $0.004 to $2.960 per gallon; and the West Coast price dipped $0.042 to $4.099 per gallon.
- For the week ended March 8, there were 220,000 new claims for unemployment insurance, a decrease of 2,000 from the previous week’s level, which was revised up by 1,000. According to the Department of Labor, the advance rate for insured unemployment claims for the week ended March 1 was 1.2%. The advance number of those receiving unemployment insurance benefits during the week ended March 1 was 1,870,000, a decrease of 27,000 from the previous week’s level. States and territories with the highest insured unemployment rates for the week ended February 22 were Rhode Island (3.4%), New Jersey (2.9%), Massachusetts (2.6%), Minnesota (2.6%), California (2.4%), Illinois (2.4%), Montana (2.4%), Washington (2.4%), Connecticut (2.1%), and New York (2.1%). The largest increases in initial claims for unemployment insurance for the week ended March 1 were in New York (+15,513), Texas (+1,774), Kentucky (+891), Arkansas (+603), and New Hampshire (+573), while the largest decreases were in Massachusetts (-3,885), Rhode Island (-1,984), Michigan (-1,933), Illinois (-1,051), and Iowa (-982).
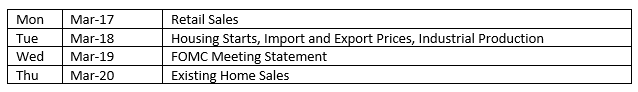
Eye on the Week Ahead
The Federal Open Market Committee meets this week. While it is unlikely that the Committee will adjust the federal funds rate at this time, investors will pay particular attention to the Committee’s assessment of the economy and whether it gives any indication of the timing of future rate changes.
The Week Ahead
The information provided is obtained from sources believed to be reliable. Forecasts cannot be guaranteed. Past performance is not a guarantee of future results.
© 2021 Broadridge Financial Solutions, Inc. All Rights Reserved.