A late-week rally helped push stocks higher to close a turbulent week on a favorable note. Last week began with stocks mixed as investors tried to gauge President Trump’s on-again, off-again tariff policy. Ten-year Treasury yields jumped nearly 20 basis points to 4.20% last Monday, rebounding from the previous week’s six-month low. Stocks retreated last Tuesday following the administration’s threat of a 104% tariff on China, effective the following day. However, investors returned to risk after President Trump announced a 90-day pause on many of his new tariffs. The market enjoyed its best day in several years as the S&P 500 gained 9.5%, the Dow rose 7.9%, and the NASDAQ climbed 12.2%. Wall Street reversed course on Thursday, cutting into most of the prior day’s gains. Investors re-focused their attention on the likelihood of a trade war with China. Typical of the volatile week, stocks rebounded to close out the week as optimism grew over a possible trade deal between the U.S. and China. Market sector performance was mixed, with information technology, communication services, and consumer discretionary outperforming, while real estate, financials, and energy lagged.
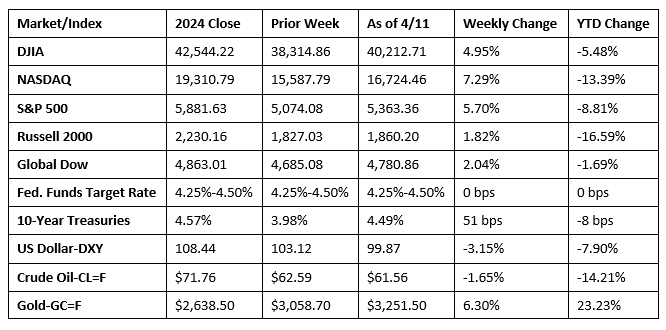
Chart reflects price changes, not total return. Because it does not include dividends or splits, it should not be used to benchmark performance of specific investments.
Last Week’s Economic News
- Inflation trended lower in March, according to the latest Consumer Price Index, which fell 0.1% last month after increasing 0.2% in February. Over the last 12 months, the CPI rose 2.4% after increasing 2.8% for the 12 months ended in February. Prices for energy fell 2.4%, largely on the heels of a 6.3% decline in gasoline prices, which offset increases in prices for electricity and natural gas. Prices for food, on the other hand, rose 0.4% in March. Core prices, less food and energy, rose 0.1% last month following a 0.2% increase in February. Core prices rose 2.8% over the last 12 months, the smallest 12-month increase since the period ended March 2021.
- Prices at the wholesale level fell 0.4% in March, according to the Producer Price Index (PPI). The PPI increased 0.1% in February. For the 12 months ended in March, the PPI advanced 2.7%. Over 70% of the decrease in wholesale prices in March was traced to a 0.9% decline in prices for goods, which was the largest decrease since October 2023. Gasoline prices fell 11.1% in March, accounting for two-thirds of the decline in prices for goods. Prices for services fell 0.2% last month. Prices less foods, energy, and trade services edged up 0.1% in March after increasing 0.4% in each of the previous three months. For the 12 months ended in March, prices less foods, energy, and trade services advanced 3.4%.
- The federal government budget deficit was $161 billion in March. Receipts were $368 billion, while expenditures totaled $528 billion. For fiscal year 2025, the deficit sits at $1,307 billion. Total receipts were $2,260 billion. Government outlays were $3,567 billion. Over the same period in the prior fiscal year, the deficit was $1,065 billion. Receipts were $2,188 billion, while expenditures were $3,253 billion.
- The national average retail price for regular gasoline was $3.243 per gallon on April 7, $0.081 per gallon above the prior week’s price but $0.348 per gallon less than a year ago. Also, as of April 7, the East Coast price ticked up $0.087 to $3.079 per gallon; the Midwest price increased $0.029 to $3.103 per gallon; the Gulf Coast price rose $0.111 to $2.841 per gallon; the Rocky Mountain price increased $0.054 to $3.165 per gallon; and the West Coast price rose $0.139 to $4.320 per gallon.
- For the week ended April 5, there were 223,000 new claims for unemployment insurance, an increase of 4,000 from the previous week’s level. According to the Department of Labor, the advance rate for insured unemployment claims for the week ended March 29 was 1.2%. The advance number of those receiving unemployment insurance benefits during the week ended March 29 was 1,850,000, a decrease of 43,000 from the previous week’s level, which was revised down by 10,000. States and territories with the highest insured unemployment rates for the week ended March 22 were Rhode Island (2.7%), New Jersey (2.6%), California (2.4%), Massachusetts (2.3%), Minnesota (2.3%), Washington (2.3%), Illinois (2.1%), District of Columbia (1.9%), New York (1.9%), and Montana (1.8%). The largest increases in initial claims for unemployment insurance for the week ended March 29 were in Kentucky (+2,810), Illinois (+1,286), Iowa (+937), Wisconsin (+742), and Ohio (+404), while the largest decreases were in Texas (-765), Pennsylvania (-755), Massachusetts (-603), Arizona (-519), and New Jersey (-436).
Eye on the Week Ahead
The latest data on sales at the retail level is available this week. February saw retail sales tick up 0.2% for the month. Also out this week is the estimate of industrial production for March. Industrial production rose 0.7% in February, while manufacturing output increased 0.9%.
The Week Ahead

The information provided is obtained from sources believed to be reliable. Forecasts cannot be guaranteed. Past performance is not a guarantee of future results.
© 2021 Broadridge Financial Solutions, Inc. All Rights Reserved.