Wall Street enjoyed another solid week of gains on the heels of some strong corporate earnings data, a better-than-expected jobs report, and more signs that the White House and China may be open to trade talks. By the close of trading last Friday, the Dow had posted 10 straight sessions of gains, while the S&P 500 enjoyed nine consecutive sessions. Investors have seen signs that the economy is resilient in the face of tariffs, despite the fact that the GDP contracted in the first quarter. Tech shares have played a large part in driving the market higher. Information technology rose about 6.0% last week to lead gains for nearly all of the market sectors, with the exception of energy, which was flat. Crude oil prices declined for the second straight week on fears of sluggish Chinese demand, rising U.S. production, and concerns that OPEC+ will boost supply. The dollar ticked higher for the second week in a row, while bond markets seemed to have responded to concerns that trade policies could still slow the economy, putting pressure on the Federal Reserve to cut interest rates.
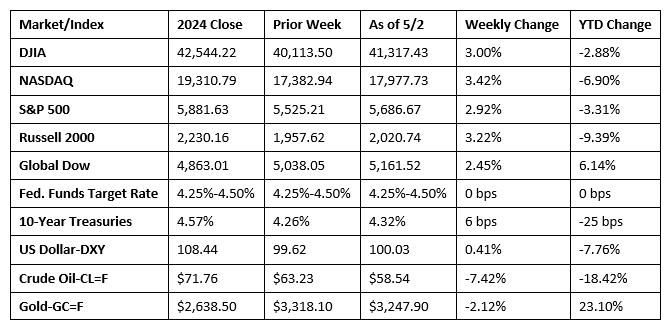
Chart reflects price changes, not total return. Because it does not include dividends or splits, it should not be used to benchmark performance of specific investments.
Last Week’s Economic News
- There were 177,000 new jobs added in April, according to the latest report from the Bureau of Labor Statistics. The average monthly gain over the 12 months ended in April was 152,000. The change in employment for February was revised down by 15,000, and the change for March was revised down by 43,000. With these revisions, employment in February and March combined was 58,000 lower than previously reported. In April, employment continued to trend up in health care, transportation and warehousing, financial activities, and social assistance. Federal government employment declined. The number of unemployed, at 7.2 million, rose by less than 100,000. The unemployment rate was unchanged at 4.2%. The labor force participation rate and the employment-population ratio each ticked up 0.1 percentage point to 62.6% and 60.0%, respectively. In April, the number of long-term unemployed (those jobless for 27 weeks or more) increased by 179,000 to 1.7 million. The long-term unemployed accounted for 23.5% of all unemployed people. In April, average hourly earnings rose by $0.06, or 0.2%, to $36.06. Over the past 12 months, average hourly earnings have increased by 3.8%. The average workweek was unchanged at 34.3 hours in April.
- The first, or advance, estimate of first-quarter gross domestic product showed economic growth declined 0.3%, the first negative quarter since the first quarter of 2022 and below the consensus of up 0.2%. The decline in GDP was largely attributable to a significant increase in imports, which are a negative in the calculation of GDP, likely due to the anticipation of higher tariffs increasing the cost of imports. Personal consumption expenditures rose 1.8% in the first quarter (4.0% in the fourth quarter), making a lower-than-usual 1.21% contribution to GDP. Government consumption expenditures and gross investment fell 1.4% in the first quarter, likely impacted by cuts in payrolls, services, and other expenditures.
- According to the latest Personal Income and Outlays report, personal consumption expenditures rose 0.7% in March following a 0.5% increase in February. Spending on goods rose 0.9%, while spending on services advanced 0.6%. Personal income increased 0.5% in March after increasing 0.7% in the prior month. Disposable (after-tax) personal income also increased 0.5% last month. The personal consumption expenditures price index, a measure of inflation, was unchanged in March. Excluding food and energy, prices also were flat last month. From March 2024, prices rose 2.3%, down from a 2.7% increase for the 12 months ended in February. Prices less food and energy rose 2.6% over the last 12 months, a decrease from the February estimate of 3.0%.
- The number of job openings in March, at 7.2 million, fell by about 280,000 from the February total and was 901,000 under the March 2024 total. In March, the number of hires, at 5.4 million and the number of total separations, at 5.1 million, were little changed from a month earlier. Within separations, the number of layoffs and discharges in March edged down 222,000 to 1.6 million.
- The manufacturing sector expanded marginally in April, according to the latest purchasing managers survey from S&P Global. The S&P Global US Manufacturing Purchasing Managers’ Index™ (PMI®) was 50.2 last month, unchanged since March. A minimal increase in new orders was supported by domestic demand, although tariffs resulted in heightened uncertainty and a noticeable drop in new export sales. Confidence in future growth fell to its lowest level since last June, while job losses were recorded for the first time in six months.
- The international trade in goods deficit was $162.0 billion in March, up $14.1 billion from February. Exports of goods were $180.8 billion, $2.2 billion more than February exports. Imports of goods for March were $342.7 billion, $16.3 billion more than February imports. Since March 2024, the goods deficit rose by $69.2 billion.
- The national average retail price for regular gasoline was $3.133 per gallon on April 28, $0.008 per gallon below the prior week’s price and $0.520 per gallon less than a year ago. Also, as of April 28, the East Coast price ticked up $0.004 to $2.987 per gallon; the Midwest price decreased $0.020 to $2.992 per gallon; the Gulf Coast price rose $0.002 to $2.686 per gallon; the Rocky Mountain price increased $0.004 to $3.134 per gallon; and the West Coast price declined $0.028 to $4.192 per gallon.
- For the week ended April 26, there were 241,000 new claims for unemployment insurance, an increase of 18,000 from the previous week’s level, which was revised up by 1,000. According to the Department of Labor, the advance rate for insured unemployment claims for the week ended April 19 was 1.3%, an increase of 0.1 percentage point from the previous week’s rate. The advance number of those receiving unemployment insurance benefits during the week ended April 19 was 1,916,000, an increase of 83,000 from the previous week’s level, which was revised down by 8,000. This is the highest level for insured unemployment since November 13, 2021, when it was 1,970,000. States and territories with the highest insured unemployment rates for the week ended April 12 were New Jersey (2.4%), California (2.2%), Rhode Island (2.2%), Washington (2.2%), Illinois (1.9%), Massachusetts (1.9%), Minnesota (1.9%), the District of Columbia (1.8%), New York (1.7%), and Oregon (1.7%). The largest increases in initial claims for unemployment insurance for the week ended April 19 were in New Jersey (+2,875), Connecticut (+2,231), Rhode Island (+1,868), Maryland (+452), and Arizona (+450), while the largest decreases were in Kentucky (-4,613), Texas (-1,896), Oklahoma (-1,336), California (-1,226), and Virginia (-886).
Eye on the Week Ahead
The Federal Open Market Committee meets this week. It is not likely that a rate cut will result from the May meeting, although the consensus is that interest rates will be reduced at least two times before the end of the year.
The Week Ahead

The information provided is obtained from sources believed to be reliable. Forecasts cannot be guaranteed. Past performance is not a guarantee of future results.
© 2021 Broadridge Financial Solutions, Inc. All Rights Reserved.