Stocks enjoyed another winning week, despite a pullback last Friday. Overall, investor sentiment remained optimistic due to continued expectations of an interest rate reduction by the Federal Reserve next month. The latest data (see below) revealed that inflationary pressures showed signs of moving higher. Retail sales advanced in July, as expected, as summer spending remained solid, although sales in some sectors exposed to higher tariffs declined. In addition, more tariffs could be forthcoming after President Trump said he would announce tariffs on imports of steel and semiconductor chips in the coming weeks. Health care outperformed among the market sectors, while industrials, real estate, and utilities declined. Bond yields held around 4.3% for most of the week. Crude oil prices declined as traders awaited the outcome of talks between Presidents Trump and Putin, with expectations that a ceasefire between Russia and Ukraine could lead to increased Russian oil production.
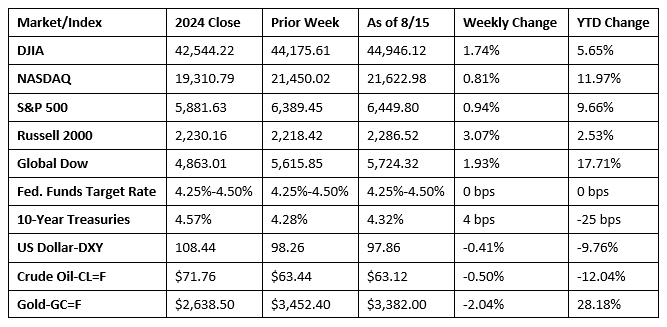
Chart reflects price changes, not total return. Because it does not include dividends or splits, it should not be used to benchmark performance of specific investments.
Last Week’s Economic News
- The Consumer Price Index for July rose 0.2% after increasing 0.3% the prior month. Shelter prices rose 0.2% in July and were the primary factor in the monthly increase. In July, food prices were unchanged from the previous month, while energy prices fell 1.1%. Prices less food and energy (core prices) advanced 0.3% in July (0.2% in June). Over the last 12 months, consumer prices have risen 2.7%, unchanged from the same period ended in June. Core prices rose 3.1% for the 12 months ended in July, up 0.2 percentage point from the June figure.
- The Producer Price Index rose 0.9% in July after being unchanged in June. Producer prices advanced 3.3% for the 12 months ended in July, the largest 12-month increase since rising 3.4% in February 2025. A 1.1% increase in prices for services accounted for more than 75% of the overall increase in prices. Goods prices rose 0.7% last month. In July, producer prices less foods and energy rose 0.4%, while prices less foods, energy, and trade services advanced 0.6%. This report may evidence a jump in consumer prices down the line as higher tariffs are passed through.
- Retail sales rose 0.5% in July and were 3.9% above the July 2024 estimate. Retail trade sales were up 0.7% last month and 3.7% from last year. Nonstore (online) retailer sales were up 0.8% from June and 8.0% from last year. Sales at food services and drinking places fell 0.4% in July but were up 5.6% from a year ago.
- U.S. import prices increased 0.4% in July, while export prices ticked up 0.1%. Since July 2024, import prices declined 0.2%, while export prices advanced 2.2%.
- Industrial production (IP) edged down 0.1% in July. Manufacturing output was unchanged after increasing 0.3% in June. In July, mining declined 0.4% and utilities decreased 0.2%. Total IP in July was 1.4% above its year-earlier level. Since July 2024, manufacturing increased 1.4%, mining rose 1.9%, and utilities advanced 0.8%.
- The Treasury deficit for July was $291 billion. July has been a deficit month 69 times out of 71 fiscal years, primarily because there are no major corporate or individual tax due dates in this month. In July, government receipts totaled $338 billion, while expenditures were $630 billion. Through the first 10 months of the fiscal year, receipts totaled $4,347 billion, while outlays added up to $5,975 billion, rendering a total deficit of $1,629 billion. This compares with a total deficit of $1,517 billion for the same period last fiscal year, a difference of $112 billion.
- The national average retail price for regular gasoline was $3.118 per gallon on August 11, $0.022 per gallon below the prior week’s price and $0.296 per gallon less than a year ago. Also, as of August 11, the East Coast price decreased $0.011 to $3.005 per gallon; the Midwest price fell $0.046 to $2.997 per gallon; the Gulf Coast price ticked down $0.051 to $2.680 per gallon; the Rocky Mountain price increased $0.032 to $3.159 per gallon; and the West Coast price rose $0.009 to $4.032 per gallon.
- For the week ended August 9, there were 224,000 new claims for unemployment insurance, a decrease of 3,000 from the previous week’s level, which was revised up by 1,000. According to the Department of Labor, the advance rate for insured unemployment claims for the week ended August 2 was 1.3%, unchanged from the previous week’s rate. The advance number of those receiving unemployment insurance benefits during the week ended August 2 was 1,953,000, a decrease of 15,000 from the previous week’s level, which was revised down by 6,000. States and territories with the highest insured unemployment rates for the week ended July 26 were New Jersey (2.7%), Puerto Rico (2.6%), Rhode Island (2.5%), California (2.2%), Massachusetts (2.2%), Minnesota (2.2%), the District of Columbia (2.1%), Washington (2.1%), Connecticut (1.9%), Oregon (1.9%), and Pennsylvania (1.9%). The largest increases in initial claims for unemployment insurance for the week ended August 2 were in Texas (+1,002), New Jersey (+942), Connecticut (+555), Oregon (+488), and Pennsylvania (+445), while the largest decreases were in New York (-1,017), California (-924), Kansas (-506), Georgia (-375), and Louisiana (-341).
Eye on the Week Ahead
July data on housing starts and existing home sales is available this week. The housing sector has slowed somewhat due to elevated mortgage rates and asking prices.
The Week Ahead

The information provided is obtained from sources believed to be reliable. Forecasts cannot be guaranteed. Past performance is not a guarantee of future results.
© 2025 Broadridge Financial Solutions, Inc. All Rights Reserved.