The stock market was heavily influenced last week by new data on the labor market, which continued to show signs of cooling and bolstered expectations of a potential interest rate cut by the Federal Reserve later this month. Throughout last week, Wall Street experienced some significant swings driven by economic data. The week began with a downturn but ended on a positive note, with both the S&P 500 and the NASDAQ hitting new record highs on Friday. Shares of big tech companies were a major factor in the market’s overall movement. Otherwise, the most significant economic news was last Friday’s jobs report (see below), which further highlighted a slowdown in hiring. Ten-year Treasury yields fell sharply by last week’s end, reaching the lowest level in five months, driven by the weakening labor market and a dovish outlook for an interest rate cut.
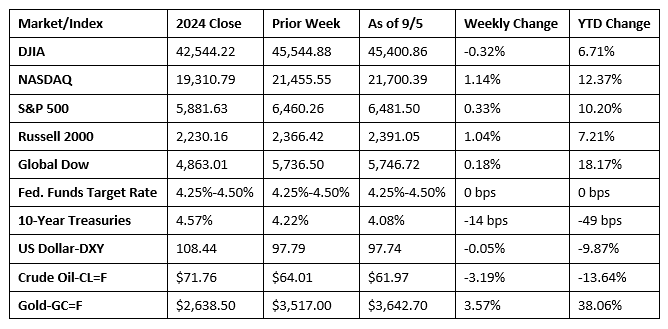
Chart reflects price changes, not total return. Because it does not include dividends or splits, it should not be used to benchmark performance of specific investments.
Last Week’s Economic News
- Job growth was muted for the second straight month in August after increasing by a mere 22,000. The unemployment rate ticked up 0.1 percentage point to 4.3%. The number of unemployed rose by 148,000 to 7.4 million. The employment-population ratio was unchanged at 59.6%, while the labor force participation rate inched up 0.1 percentage point to 62.3%. The number of long-term unemployed (those jobless for 27 weeks or more) increased by 104,000 to 1.9 million. The change in total employment for June was revised down by 27,000, from +14,000 to -13,000, and the change for July was revised up by 6,000, from +73,000 to +79,000. With these revisions, employment in June and July combined is 21,000 lower than previously reported. Average hourly earnings rose by $0.10, or 0.3%, to $36.53 in August. Over the past 12 months, average hourly earnings have increased by 3.7%. In August, the average workweek was 34.2 hours for the third month in a row.
- According to the latest Job Openings and Labor Turnover Summary for July, the number of job openings fell from 7.4 million to 7.2 million. In July, the number of hires inched up marginally to 5.3 million. The number of separations, which includes quits, layoffs and discharges, and other separations, dipped slightly to 5.3 million. Within separations, both quits (3.2 million) and layoffs and discharges (1.8 million) were unchanged.
- According to S&P Global, the services sector continued to expand in August after a marginal softening in July. A notable uptick in new business helped support the increase in business activity and encouraged companies to add to their workforces. Despite the increase in activity, worries over tariffs and associated uncertainty caused a drop in confidence to its lowest level in four months.
- U.S. manufacturing operating conditions improved to the greatest degree in over three years during August amid a surge in production and solid growth in new orders. The S&P Global US Manufacturing Purchasing Managers’ Index™ (PMI®) posted 53.0 in August, up from 49.8 in July, marking the strongest improvement in operating conditions since May 2022.
- The report on international trade in goods and services, released September 4, was for July and revealed that the trade deficit expanded 32.5%. Exports rose 0.3%, while imports jumped 5.9%. Year to date, the goods and services deficit increased 30.9% from the same period in 2024. Exports increased 5.5%. Imports advanced 10.9%.
- The national average retail price for regular gasoline was $3.177 per gallon on September 1, $0.030 per gallon above the prior week’s price but $0.112 per gallon less than a year ago. Also, as of September 2, the East Coast price increased $0.025 to $3.012 per gallon; the Midwest price rose $0.011 to $3.088 per gallon; the Gulf Coast price increased $0.071 to $2.765 per gallon; the Rocky Mountain price climbed $0.025 to $3.183 per gallon; and the West Coast price rose $0.042 to $4.148 per gallon.
- For the week ended August 30, there were 237,000 new claims for unemployment insurance, an increase of 8,000 from the previous week’s level. According to the Department of Labor, the advance rate for insured unemployment claims for the week ended August 23 was 1.3%, unchanged from the previous week’s rate. The advance number of those receiving unemployment insurance benefits during the week ended August 23 was 1,940,000, a decrease of 4,000 from the previous week’s level, which was revised down by 10,000. States and territories with the highest insured unemployment rates for the week ended August 16 were New Jersey (2.8%), Rhode Island (2.6%), Puerto Rico (2.3%), Massachusetts (2.2%), Minnesota (2.1%), Washington (2.1%), California (2.0%), the District of Columbia (2.0%), Connecticut (1.9%), Oregon (1.9%), and Pennsylvania (1.9%). The largest increases in initial claims for unemployment insurance for the week ended August 23 were in New York (+1,430), Texas (+1,230), Illinois (+509), Missouri (+206), and Hawaii (+119), while the largest decreases were in Iowa (-1,235), Virginia (-857), Maryland (-562), Pennsylvania (-482), and Connecticut (-455).
Eye on the Week Ahead
Inflation data for August is available this week. Attention will focus primarily on the Consumer Price Index, which has risen incrementally but steadily over the past several months. The Producer Price Index is also out this week. Last month, producer prices rose 0.9% in July and 3.3% for the year.
The Week Ahead

The information provided is obtained from sources believed to be reliable. Forecasts cannot be guaranteed. Past performance is not a guarantee of future results.
© 2025 Broadridge Financial Solutions, Inc. All Rights Reserved.