Volatility continued to characterize the stock market last week. Wall Street endured significant swings driven by a mix of key corporate earnings reports, important economic data following the government’s reopening, and shifting expectations for the Federal Reserve interest rate policy. Each of the benchmark indexes listed here ended the week in the red, unable to recover from a sharp midweek sell-off, despite a rally last Friday. Most of the negative market returns were within the consumer discretionary and information technology sectors. Communication services outperformed last week. Tech shares took a notable downturn last week, despite a favorable earnings report from a major AI/tech giant. The release of the September jobs report (see below), delayed due to the government shutdown, provided mixed signals on the state of the U.S. economy in general and Federal Reserve policy in particular. Better-than-expected job growth was offset by an increase in the unemployment rate, which reinforced the Fed’s dilemma regarding future interest rate cuts. The yield on 10-year Treasuries eased slightly, ending the week down eight basis points. Oversupply concerns drove crude oil prices to a four-week low.
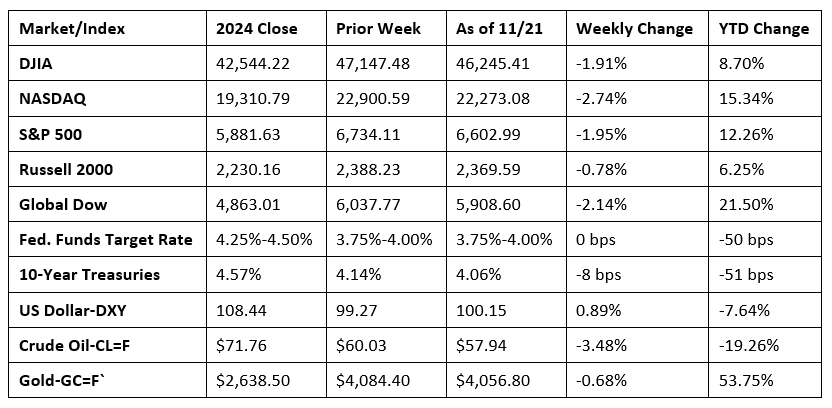
Chart reflects price changes, not total return. Because it does not include dividends or splits, it should not be used to benchmark performance of specific investments.
Last Week’s Economic News
- Following a more than six-week delay due to the government shutdown, the Bureau of Labor Statistics released employment data for September. Employment rose by 119,000 in September but has shown little change since April. In September, employment continued to trend up in health care, food services and drinking places, and social assistance. Job losses occurred in transportation and warehousing and in federal government. The total number of unemployed rose by 219,000 to 7.6 million, while the unemployment rate ticked up 0.1 percentage point to 4.4%. These measures were higher than a year earlier, when the jobless rate was 4.1%, and the number of unemployed people was 6.9 million. Following downward revisions, total employment in July and August combined was 33,000 lower than previously reported. The labor force participation rate (62.4%) and the employment-population ratio (59.7%) each rose 0.1 percentage point in September from the prior month. The number of long-term unemployed (those jobless for 27 weeks or more) dipped by 116,000 to 1.8 million in September. The long-term unemployed accounted for 23.6% of all unemployed people. Average hourly earnings rose by $0.09, or 0.2%, to $36.67 in September. Over the past 12 months, average hourly earnings have increased by 3.8%. In September, the average workweek was unchanged at 34.2 hours.
- For the week ended November 15, there were 220,000 new claims for unemployment insurance, a decrease of 8,000 from the previous week’s level. According to the Department of Labor, the advance rate for insured unemployment claims for the week ended November 8 was 1.3%, unchanged from the previous week’s rate. The advance number of those receiving unemployment insurance benefits during the week ended November 8 was 1,974,000, an increase of 28,000 from the previous week’s level. This was the highest level for insured unemployment since November 6, 2021, when it was 2,041,000. States and territories with the highest insured unemployment rates for the week ended November 1 were New Jersey (2.2%), Washington (2.1%), the District of Columbia (2.0%), California (1.9%), Massachusetts (1.9%), Puerto Rico (1.9%), Connecticut (1.7%), Nevada (1.7%), Oregon (1.7%), and Rhode Island (1.7%). The largest increases in initial claims for unemployment insurance for the week ended November 8 were in California (+6,728), New Jersey (+3,302), Texas (+3,101), Michigan (+2,598), and Pennsylvania (+1,816), while the largest decreases were in Kentucky (-5,500), Missouri (-3,166), Arkansas (-597), Indiana (-411), and Nebraska (-386).
- The national average retail price for regular gasoline was $3.062 per gallon on November 17, $0.006 per gallon above the prior week’s price and $0.016 per gallon higher than a year ago. Also, as of November 17, the East Coast price increased $0.041 to $2.953 per gallon; the Midwest price dipped $0.003 to $2.907 per gallon; the Gulf Coast price inched up $0.001 to $2.600 per gallon; the Rocky Mountain price rose $0.040 to $2.949 per gallon; and the West Coast price fell $0.039 to $4.120 per gallon.
Eye on the Week Ahead
The end of the government shutdown should result in the release of economic data and reports. We will continue to track the release of important economic reports as they become available.
The Week Ahead

The information provided is obtained from sources believed to be reliable. Forecasts cannot be guaranteed. Past performance is not a guarantee of future results.
© 2025 Broadridge Financial Solutions, Inc. All Rights Reserved.